11. Labor supply - working hours

The supply of labor input will also increase if working hours increase. An increase in working hours raises employment in terms of hours and in the short run it reduces the number of workers employed. The following sections present a shock to working hours with and without balanced public budget.


hmtoggle_arrow1A. Working hours


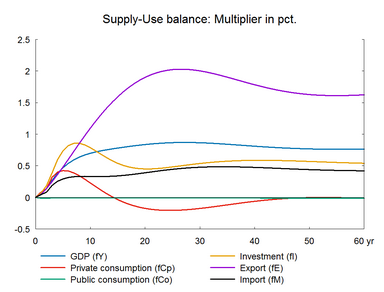
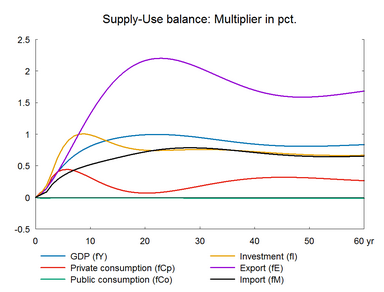
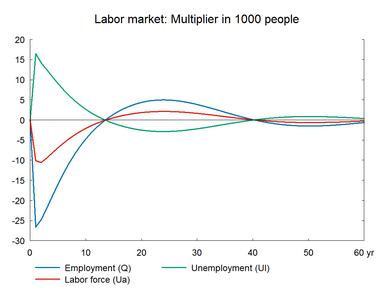
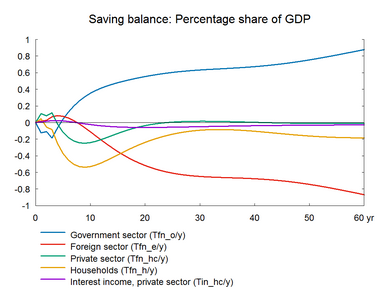
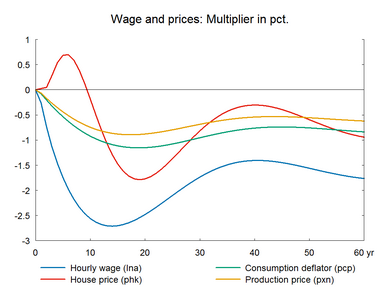
Table 11a presents the effect of a permanent 1 percent increase in working hours. (See experiment)


Table 11a. The effect of a permanent increase in working hours

    1. yr 2. yr 3. yr 4. yr 5. yr 10. yr 15. yr 20. yr 25. yr 30. yr
    Million 2010-Dkr.
Priv. consumption fCp 778 1297 3028 3860 4161 2417 -393 -2123 -2703 -2476
Pub. consumption fCo -59 -53 -48 -43 -40 -32 -33 -37 -46 -59
Investment fI 325 830 1782 2799 3531 4091 3025 2725 3144 3769
Export fE 556 1588 2835 4186 5666 13954 21844 28086 32215 34370
Import fM 443 837 1997 2772 3259 4083 4531 5598 6885 7966
GDP fY 1165 2771 5475 7807 9725 15435 18547 21382 23864 25665
    1000 Persons
Employment Q -26.60 -24.75 -21.99 -19.15 -16.50 -7.13 -2.16 1.08 2.95 3.36
Unemployment Ul 16.47 14.17 12.52 10.90 9.38 4.04 1.21 -0.65 -1.71 -1.93
    Percent of GDP
Pub. budget balance Tfn_o/Y -0.12 -0.11 -0.19 -0.07 0.03 0.29 0.39 0.48 0.56 0.62
Priv. saving surplus Tfn_hc/Y 0.11 0.08 0.12 -0.02 -0.11 -0.22 -0.10 -0.02 0.01 0.02
Balance of payments Enl/Y -0.02 -0.03 -0.07 -0.09 -0.09 0.08 0.29 0.46 0.57 0.64
Foreign receivables Wnnb_e/Y 0.06 0.18 0.20 0.18 0.18 0.60 1.83 3.55 5.44 7.33
Bond debt Wbd_os_z/Y 0.11 0.21 0.36 0.41 0.37 -0.60 -2.05 -3.63 -5.27 -6.91
    Percent
Capital intensity fKn/fX -0.05 -0.13 -0.24 -0.33 -0.39 -0.49 -0.56 -0.65 -0.72 -0.73
Labour intensity hq/fX -0.02 -0.04 -0.08 -0.10 -0.10 -0.08 -0.04 -0.02 0.01 0.03
User cost uim -0.09 -0.22 -0.34 -0.44 -0.53 -0.90 -1.10 -1.19 -1.19 -1.13
Wage lna -0.26 -0.74 -1.14 -1.47 -1.76 -2.69 -3.09 -3.16 -3.01 -2.76
Consumption price pcp -0.08 -0.20 -0.33 -0.43 -0.54 -0.96 -1.24 -1.40 -1.43 -1.39
Terms of trade bpe -0.06 -0.15 -0.24 -0.31 -0.38 -0.66 -0.82 -0.89 -0.88 -0.83
    Percentage-point
Consumption ratio bcp -0.11 -0.08 -0.11 -0.01 0.05 0.10 -0.02 -0.12 -0.18 -0.21
Wage share byw -0.10 -0.25 -0.39 -0.48 -0.54 -0.67 -0.66 -0.58 -0.47 -0.37

(See details)


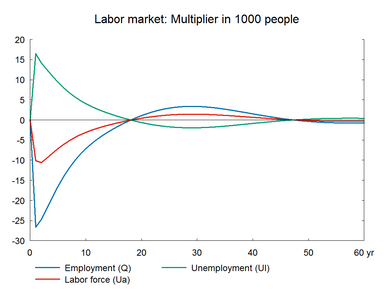
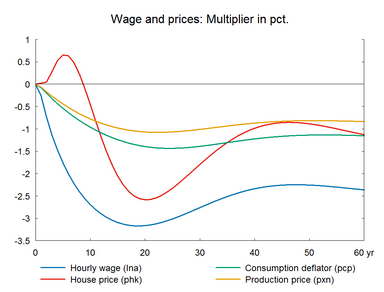
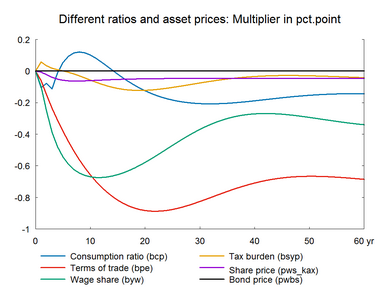
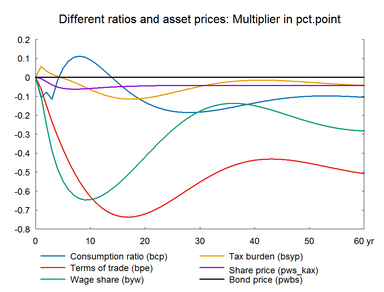
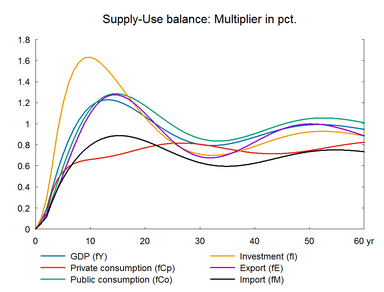
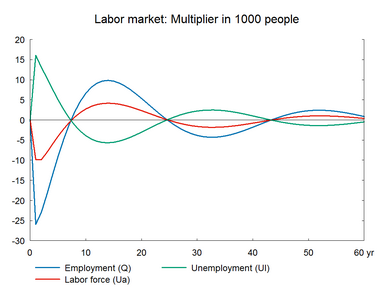
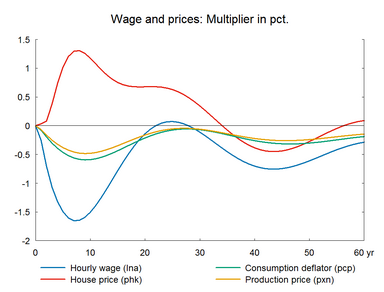
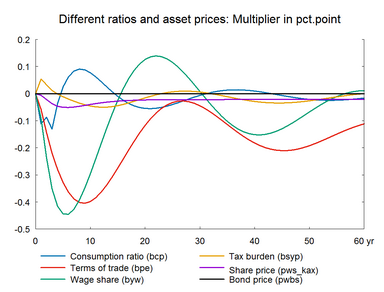
When working hours of existing workers increase potential production increases immediately. Compared to the previous experiment the initial reaction via the production function is stronger in the present experiment because the working hours of already employed people increases. In the short run, there is no change in demand, so layoffs are inevitable and employment falls. The rise in unemployment dampens wages and competitiveness improves. Consequently, the wage-driven crowding out returns unemployment to the baseline in the long run. The wage relation in ADAM is a Phillips curve, which links the changes in wages to unemployment. A fall/rise in unemployment pushes wages and hence prices upward/downward and reduces/improves competitiveness. So exports and production decrease/increase and over time unemployment returns to its baseline. This is the wage-driven crowding out process.


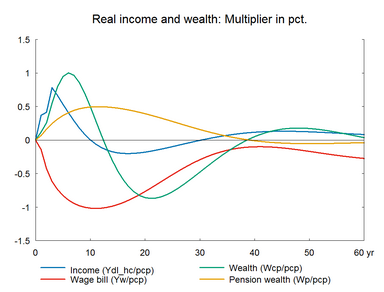
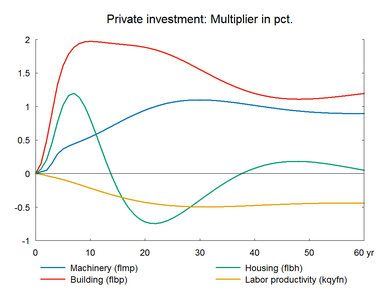
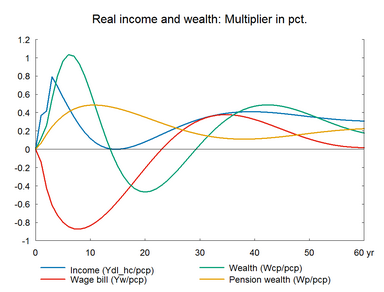
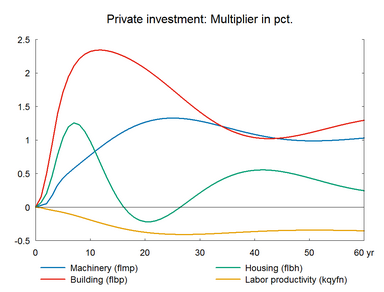
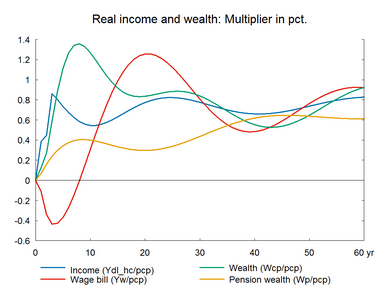
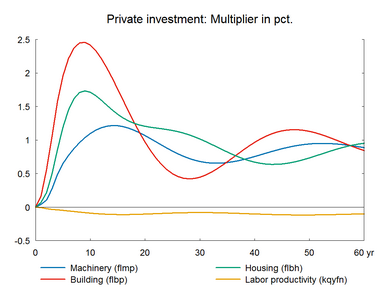
The previous section 10 showed that private consumption falls in the long term when the positive shock to labor input is in number of workers. When working hours increase, there is no fall in private consumption in the long run. Public transfer income is adjusted with the income per worker. Thus, the fall in total real income is smaller than in the previous experiment because the real income of public transfer earners is adjusted upwards with the number of working hours per employed. Transfer income is not adjusted with the number of employed. In this way, the different impact on consumption in experiment 10 and 11 reflects the institutional setup. The marginal increase in disposable income is not enough to raise private consumption in the long run as there is also a fall in real wealth due to a fall in housing wealth. The higher investment raises imports in the long run.


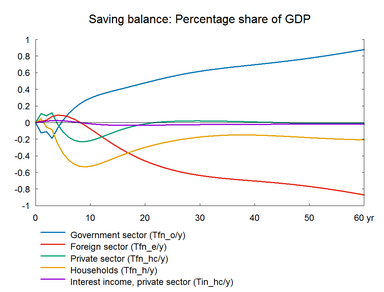
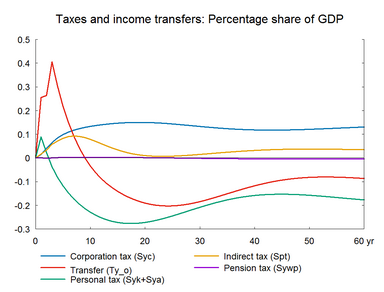
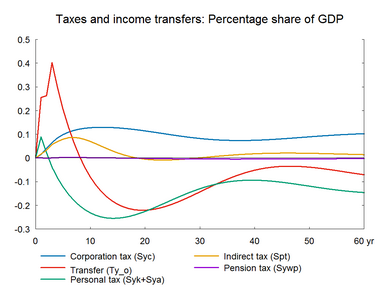
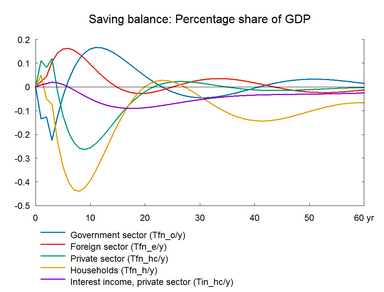
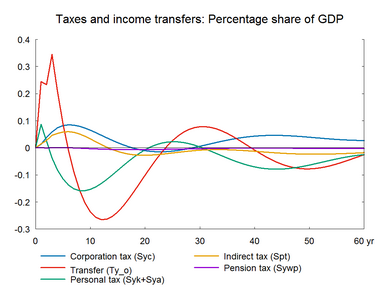
There is a positive effect on the public budget in the long run, because the fall in public expenses is larger than the fall in revenues. Personal income taxes do not fall as much as annual incomes, as the higher working hours offset the fall in annual incomes. Corporate taxes also increase due to the increase in profits. Indirect taxes also contribute to revenue. However, the positive long term effect on the public budget is smaller than in experiment 10 due to the indexation of public transfers.


Figure 11a. The effect of a permanent increase in working hours


fig_11_1a_zoom38fig_11_2a_zoom38


fig_11_3a_zoom38fig_11_4a_zoom38


fig_11_5a_zoom38fig_11_6a_zoom38


fig_11_7a_zoom38fig_11_8a_zoom38

hmtoggle_arrow1B. Working hours - including supply effects on exports


A permanent increase in working hours has a permanent positive effect on domestic output; and it is likely that the market shares of danish exporter will rise. Table 10x presents the effect of a permanent increase in labor supply accompanied by supply effects in foreign trade. In contrast to section A, export performance are improved by an elasticity of 0.7 relative to GVA (gross value added).(See experiment)


Table 11b. The effect of a permanent increase in working hours, with supply effects

    1. yr 2. yr 3. yr 4. yr 5. yr 10. yr 15. yr 20. yr 25. yr 30. yr
    Million 2010-Dkr.
Priv. consumption fCp 778 1301 3050 3925 4301 3299 1485 840 1362 2551
Pub. consumption fCo -59 -53 -48 -43 -40 -34 -39 -51 -66 -83
Investment fI 325 845 1841 2942 3796 5142 4638 4512 4873 5326
Export fE 556 1642 3022 4620 6438 16822 25985 32016 34792 35128
Import fM 443 871 2124 3077 3816 6371 8360 10349 12005 13049
GDP fY 1165 2809 5613 8140 10336 17925 22337 25342 27217 28106
    1000 Persons
Employment Q -26.60 -24.72 -21.87 -18.86 -15.95 -4.71 1.43 4.36 4.95 3.84
Unemployment Ul 16.47 14.15 12.45 10.72 9.05 2.63 -0.86 -2.53 -2.85 -2.20
    Percent of GDP
Pub. budget balance Tfn_o/Y -0.12 -0.11 -0.19 -0.07 0.04 0.35 0.48 0.55 0.60 0.63
Priv. saving surplus Tfn_hc/Y 0.11 0.08 0.12 -0.02 -0.12 -0.24 -0.13 -0.04 0.01 0.02
Balance of payments Enl/Y -0.02 -0.03 -0.07 -0.08 -0.08 0.11 0.35 0.52 0.61 0.65
Foreign receivables Wnnb_e/Y 0.06 0.18 0.19 0.17 0.16 0.54 1.79 3.58 5.55 7.46
Bond debt Wbd_os_z/Y 0.11 0.21 0.36 0.40 0.35 -0.81 -2.55 -4.37 -6.12 -7.73
    Percent
Capital intensity fKn/fX -0.05 -0.13 -0.25 -0.35 -0.42 -0.58 -0.63 -0.66 -0.64 -0.58
Labour intensity hq/fX -0.02 -0.04 -0.08 -0.11 -0.12 -0.12 -0.09 -0.06 -0.03 -0.01
User cost uim -0.09 -0.22 -0.34 -0.44 -0.53 -0.87 -1.00 -1.00 -0.92 -0.81
Wage lna -0.26 -0.73 -1.14 -1.47 -1.74 -2.56 -2.70 -2.48 -2.10 -1.74
Consumption price pcp -0.08 -0.20 -0.32 -0.43 -0.54 -0.92 -1.11 -1.15 -1.08 -0.95
Terms of trade bpe -0.06 -0.15 -0.24 -0.31 -0.38 -0.63 -0.73 -0.72 -0.65 -0.56
    Percentage-point
Consumption ratio bcp -0.11 -0.08 -0.12 -0.02 0.05 0.09 -0.03 -0.13 -0.18 -0.18
Wage share byw -0.10 -0.25 -0.39 -0.48 -0.55 -0.65 -0.56 -0.42 -0.28 -0.18

(See details)


Figure 11b. The effect of a permanent increase in working hours, with supply effects


fig_11_1b_zoom38fig_11_2b_zoom38


fig_11_3b_zoom38fig_11_4b_zoom38


fig_11_5b_zoom38fig_11_6b_zoom38


fig_11_7b_zoom38fig_11_8b_zoom38

hmtoggle_arrow1C. Working hours - balanced budget


In the present case, the supply effect on exports ensures a balanced public budget leaving almost no room for income tax induced balancing in the public budget.(See experiment)


Table 11c. The effect of a permanent increase in working hours, balanced budget

    1. yr 2. yr 3. yr 4. yr 5. yr 10. yr 15. yr 20. yr 25. yr 30. yr
    Million 2010-Dkr.
Priv. consumption fCp 816 1415 3358 4541 5315 6972 8012 9453 10748 11445
Pub. consumption fCo 260 740 1487 2331 3188 6661 8087 7939 7196 6759
Investment fI 455 1271 2713 4357 5695 8475 7795 6395 5338 4978
Export fE 540 1593 2909 4401 6052 13994 17465 16232 13316 11789
Import fM 533 1149 2741 4143 5349 9753 11793 12002 11211 10488
GDP fY 1543 3821 7621 11304 14631 25697 28771 27260 24709 23808
    1000 Persons
Employment Q -25.92 -22.97 -18.51 -13.71 -9.10 6.65 9.65 5.36 -0.37 -3.84
Unemployment Ul 16.05 13.10 10.44 7.68 5.03 -3.91 -5.54 -3.03 0.26 2.23
    Percent of GDP
Pub. budget balance Tfn_o/Y -0.13 -0.13 -0.22 -0.13 -0.04 0.16 0.13 0.05 -0.02 -0.05
Priv. saving surplus Tfn_hc/Y 0.11 0.08 0.12 -0.02 -0.12 -0.26 -0.13 -0.02 0.02 0.02
Balance of payments Enl/Y -0.02 -0.04 -0.11 -0.14 -0.16 -0.10 0.00 0.03 0.00 -0.03
Foreign receivables Wnnb_e/Y 0.04 0.09 -0.01 -0.19 -0.41 -1.38 -1.72 -1.58 -1.28 -1.04
Bond debt Wbd_os_z/Y 0.11 0.22 0.40 0.48 0.48 -0.08 -0.71 -0.91 -0.78 -0.52
    Percent
Capital intensity fKn/fX -0.07 -0.17 -0.31 -0.43 -0.52 -0.61 -0.39 -0.14 0.03 0.08
Labour intensity hq/fX -0.01 -0.02 -0.04 -0.05 -0.04 0.04 0.09 0.11 0.09 0.07
User cost uim -0.09 -0.21 -0.31 -0.38 -0.44 -0.49 -0.30 -0.08 0.02 -0.01
Wage lna -0.25 -0.71 -1.07 -1.32 -1.49 -1.50 -0.78 -0.14 0.07 -0.11
Consumption price pcp -0.08 -0.19 -0.30 -0.39 -0.46 -0.59 -0.43 -0.21 -0.07 -0.07
Terms of trade bpe -0.06 -0.14 -0.22 -0.28 -0.33 -0.40 -0.28 -0.12 -0.03 -0.04
    Percentage-point
Consumption ratio bcp -0.11 -0.09 -0.13 -0.04 0.02 0.08 -0.01 -0.05 -0.04 -0.01
Wage share byw -0.09 -0.24 -0.35 -0.42 -0.44 -0.30 -0.03 0.13 0.12 0.01

(See details)


Figure 11c. The effect of a permanent increase in working hours, balanced budget


fig_11_1c_zoom38fig_11_2c_zoom38


fig_11_3c_zoom38fig_11_4c_zoom38


fig_11_5c_zoom38fig_11_6c_zoom38


fig_11_7c_zoom38fig_11_8c_zoom38