12. Productivity - labor efficiency

Increasing the efficiency of labor increases the supply of labor measured in efficiency units. An increase in labor efficiency means that the same amount of labor can produce higher output. It also reduces the demand for other factors through substitution effects. The multiplier properties are demonstrated with and without balanced public budget.


hmtoggle_arrow1A. Labor efficiency


In this experiment, labor efficiency is increased permanently by 1 percent. (See experiment)


Table 12a. The effect of a permanent increase in labor efficiency

    1. yr 2. yr 3. yr 4. yr 5. yr 10. yr 15. yr 20. yr 25. yr 30. yr
    Million 2010-Dkr.
Priv. consumption fCp 753 2302 3218 3914 4360 4650 4388 4734 5509 6418
Pub. consumption fCo 4636 4621 4625 4643 4677 5020 5481 5949 6421 6916
Investment fI 1781 2855 3608 4267 4772 5124 4262 3926 4109 4465
Export fE 2587 3916 5195 6421 7581 12038 14351 15343 15772 16105
Import fM 1500 2675 3450 4137 4684 5865 6156 6550 7061 7578
GDP fY 8112 10712 12702 14475 15954 19799 20939 21891 23147 24633
    1000 Persons
Employment Q -9.35 -7.52 -5.76 -4.00 -2.40 2.01 2.33 1.67 1.05 0.55
Unemployment Ul 5.10 3.78 2.88 1.99 1.17 -1.04 -1.19 -0.85 -0.53 -0.28
    Percent of GDP
Pub. budget balance Tfn_o/Y -0.17 -0.15 -0.07 -0.01 0.04 0.13 0.10 0.08 0.07 0.07
Priv. saving surplus Tfn_hc/Y 0.10 0.03 -0.05 -0.11 -0.16 -0.17 -0.06 0.00 0.01 0.01
Balance of payments Enl/Y -0.08 -0.11 -0.12 -0.12 -0.12 -0.04 0.04 0.07 0.08 0.07
Foreign receivables Wnnb_e/Y 0.12 0.03 -0.09 -0.22 -0.34 -0.69 -0.56 -0.22 0.13 0.43
Bond debt Wbd_os_z/Y 0.21 0.34 0.40 0.40 0.35 -0.17 -0.63 -0.88 -1.02 -1.13
    Percent
Capital intensity fKn/fX -0.38 -0.48 -0.54 -0.58 -0.60 -0.52 -0.41 -0.35 -0.32 -0.30
Labour intensity hq/fX -0.73 -0.80 -0.84 -0.87 -0.88 -0.88 -0.87 -0.86 -0.86 -0.86
User cost uim -0.38 -0.44 -0.49 -0.53 -0.56 -0.62 -0.59 -0.54 -0.50 -0.47
Wage lna -0.25 -0.39 -0.50 -0.58 -0.64 -0.64 -0.47 -0.32 -0.21 -0.15
Consumption price pcp -0.36 -0.45 -0.52 -0.58 -0.62 -0.72 -0.71 -0.68 -0.65 -0.62
Terms of trade bpe -0.28 -0.34 -0.38 -0.41 -0.44 -0.49 -0.47 -0.44 -0.41 -0.38
    Percentage-point
Consumption ratio bcp -0.15 -0.10 -0.04 0.01 0.04 0.04 -0.03 -0.07 -0.08 -0.07
Wage share byw -0.18 -0.24 -0.27 -0.29 -0.29 -0.21 -0.14 -0.10 -0.08 -0.07

(See details)


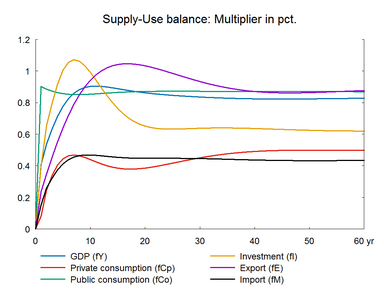
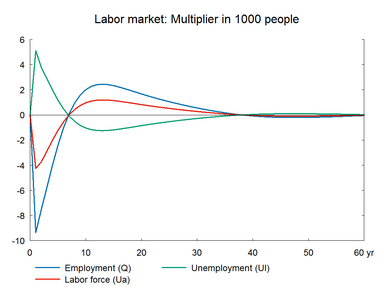
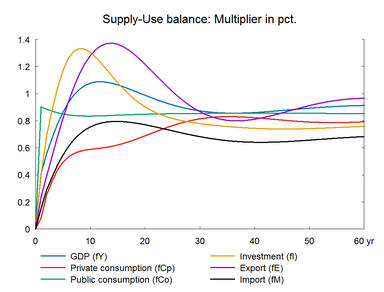
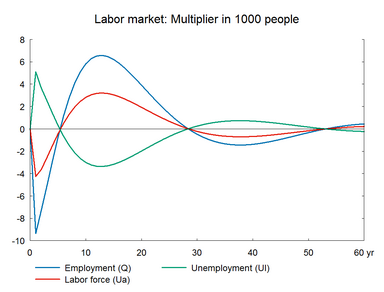
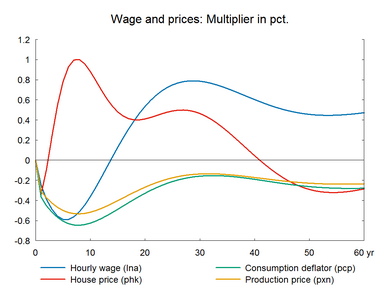
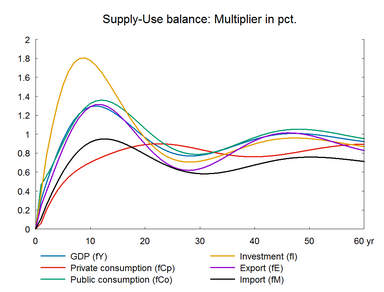
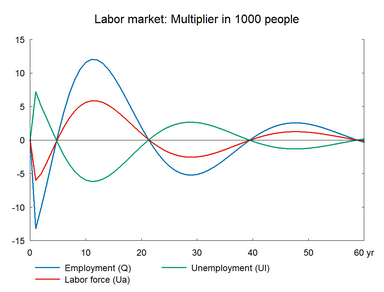
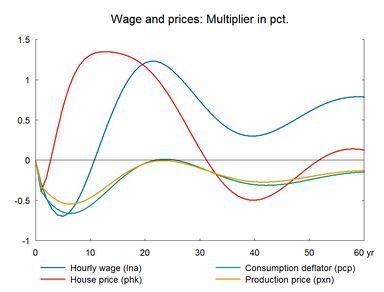
As the amount of output demanded can be produced by less labor, employment falls already in the first year, and due to lags in the labor demand relation, due to for example labor hoarding, the negative effect on employment peaks in the second year. The lower employment reduces wage growth and the wage-driven crowding out returns employment to its baseline. The wage relation in ADAM is a Phillips curve, which links the changes in wages to unemployment. A fall/rise in unemployment pushes wages and hence prices upward/downward and reduces/improves competitiveness. So exports and production decrease/increase and over time unemployment returns to its baseline. This is the wage-driven crowding out process.


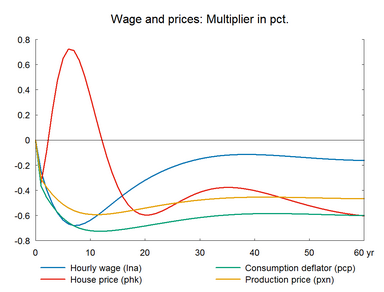
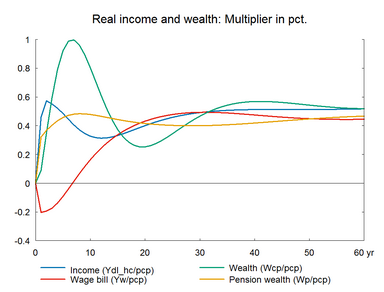
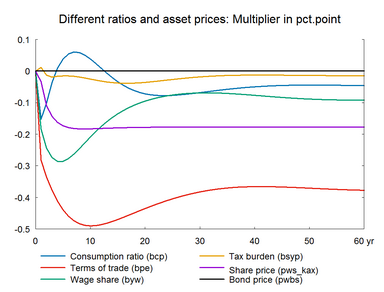
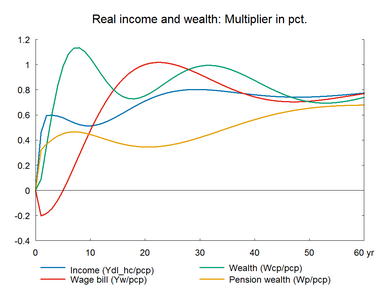
Compared to the previous two experiments - increase in number of workers and working hours - nominal hourly wages fall by a smaller percentage when labor efficiency improves, because production costs fall and make producer prices fall. Therefore, nominal wages do not have to decrease substantially to induce the fall in prices, that is necessary to make net exports increase and offset the initial fall in labor demand. This also explains the quicker response in exports in the present experiment, compared to the previous two experiments. Moreover, in the long run there is only a small negative effect on real hourly wages and there is no effect on private consumption in the long run.


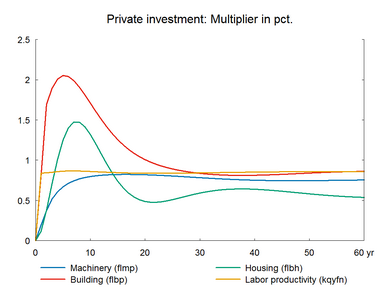
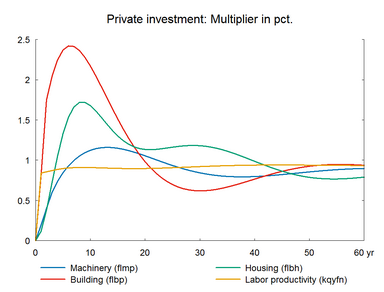
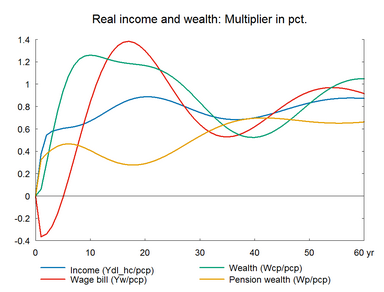
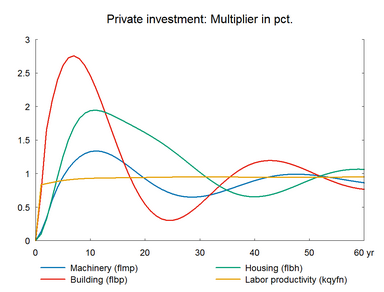
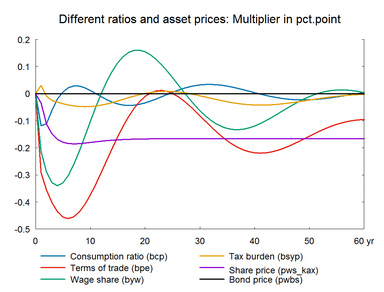
The long term impact on investments is positive as there is a long term positive impact on production. Both capital intensity and labor intensity of production fall with the usual measure of intensity, and the fall in the latter is stronger as a result labor productivity increases. Note the efficiency corrected labor intensity increases relative to the baseline and production involves less capital and more labor in efficiency units. Due to this, output per working hour increases by less than 1 percent despite the 1 percent increase in labor efficiency.


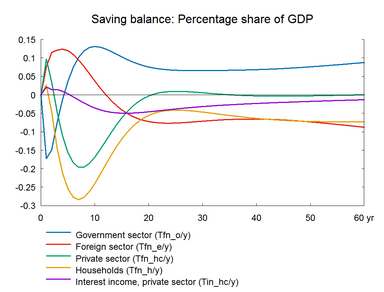
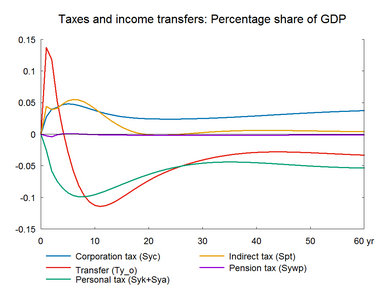
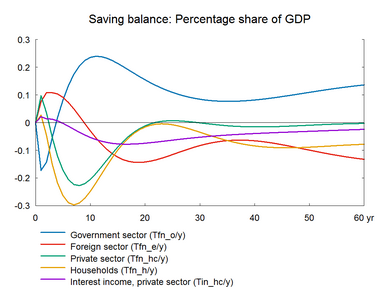
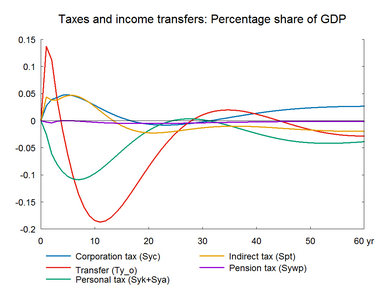
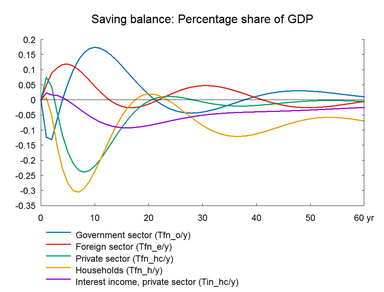
Note that the higher unemployment in the short run raises unemployment benefits and worsens public finance temporarily. Later on the initial worsening in the government budget is reversed and the permanent budget effect is positive as employment rises and tax revenues increase. The improved competitiveness and the additional public savings also enhances the balance of payment.


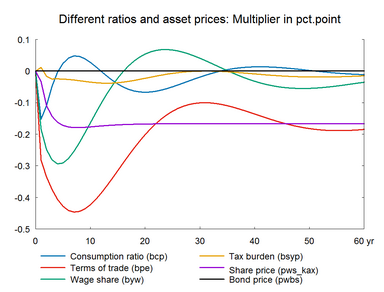
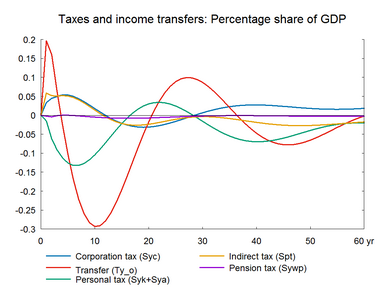
Figure 12a. The effect of a permanent increase in labor efficiency

fig_12_1a_zoom38fig_12_2a_zoom38


fig_12_3a_zoom38fig_12_4a_zoom38


fig_12_5a_zoom38fig_12_6a_zoom38


fig_12_7a_zoom38fig_12_8a_zoom38

hmtoggle_arrow1B. Labor efficiency - including supply effects on exports


A permanent increase in labor efficiency has a permanent positive effect on domestic output; and it is likely that the market shares of danish exporter will rise. Table 10x presents the effect of a permanent increase in labor efficiency accompanied by supply effects in foreign trade. In contrast to section A, export performance are improved by an elasticity of 0.7 relative to GVA (gross value added).(See experiment)


Table 12b. The effect of a permanent increase in labor efficiency, with supply effects

    1. yr 2. yr 3. yr 4. yr 5. yr 10. yr 15. yr 20. yr 25. yr 30. yr
    Million 2010-Dkr.
Priv. consumption fCp 753 2330 3358 4211 4840 6224 7069 8448 10096 11589
Pub. consumption fCo 4636 4616 4611 4617 4636 4907 5330 5792 6270 6772
Investment fI 1781 3005 3977 4848 5561 6741 6034 5432 5304 5450
Export fE 2587 4355 6154 7940 9673 16379 18800 18066 16250 14945
Import fM 1500 2950 4112 5219 6208 9442 10778 11269 11439 11592
GDP fY 8112 11040 13481 15743 17728 23622 25099 25070 25069 25718
    1000 Persons
Employment Q -9.35 -7.27 -5.11 -2.88 -0.75 5.83 6.21 3.91 1.35 -0.48
Unemployment Ul 5.10 3.65 2.53 1.40 0.31 -3.00 -3.16 -1.98 -0.67 0.25
    Percent of GDP
Pub. budget balance Tfn_o/Y -0.17 -0.14 -0.06 0.02 0.08 0.24 0.21 0.15 0.11 0.08
Priv. saving surplus Tfn_hc/Y 0.10 0.03 -0.05 -0.12 -0.17 -0.21 -0.09 -0.01 0.01 0.00
Balance of payments Enl/Y -0.08 -0.11 -0.11 -0.10 -0.09 0.03 0.12 0.14 0.12 0.08
Foreign receivables Wnnb_e/Y 0.12 0.02 -0.11 -0.25 -0.39 -0.72 -0.41 0.15 0.65 0.98
Bond debt Wbd_os_z/Y 0.21 0.33 0.37 0.33 0.25 -0.63 -1.50 -2.00 -2.20 -2.24
    Percent
Capital intensity fKn/fX -0.38 -0.49 -0.57 -0.63 -0.67 -0.62 -0.43 -0.27 -0.16 -0.09
Labour intensity hq/fX -0.73 -0.81 -0.86 -0.89 -0.91 -0.93 -0.90 -0.88 -0.88 -0.88
User cost uim -0.38 -0.44 -0.49 -0.53 -0.55 -0.55 -0.41 -0.27 -0.18 -0.14
Wage lna -0.25 -0.39 -0.49 -0.56 -0.59 -0.36 0.13 0.54 0.75 0.79
Consumption price pcp -0.36 -0.45 -0.52 -0.57 -0.61 -0.63 -0.49 -0.33 -0.21 -0.16
Terms of trade bpe -0.28 -0.34 -0.38 -0.41 -0.43 -0.43 -0.32 -0.20 -0.13 -0.10
    Percentage-point
Consumption ratio bcp -0.15 -0.11 -0.05 0.00 0.02 0.03 -0.04 -0.07 -0.05 -0.02
Wage share byw -0.18 -0.25 -0.28 -0.29 -0.29 -0.16 -0.02 0.05 0.07 0.04

(See details)


Figure 12b. The effect of a permanent increase in labor efficiency, with supply effects


fig_12_1b_zoom38fig_12_2b_zoom38


fig_12_3b_zoom38fig_12_4b_zoom38


fig_12_5b_zoom38fig_12_6b_zoom38


fig_12_7b_zoom38fig_12_8b_zoom38

hmtoggle_arrow1C. Labor efficiency - balanced budget


The supply effect on exports ensures a balanced public budget leaving almost no room for income tax induced balancing in the public budget.(See experiment)


Table 12c. The effect of a permanent increase in labor efficiency, balanced budget

    1. yr 2. yr 3. yr 4. yr 5. yr 10. yr 15. yr 20. yr 25. yr 30. yr
    Million 2010-Dkr.
Priv. consumption fCp 555 1915 2983 3949 4755 7435 9363 10926 11780 11962
Pub. consumption fCo 2393 2905 3527 4235 4970 7788 8250 7229 6249 6253
Investment fI 1703 3387 4851 6137 7201 9192 7732 5778 4798 5007
Export fE 2695 4491 6360 8238 10062 16498 16748 13294 10516 10958
Import fM 1090 2621 4083 5516 6849 11467 12576 11527 10189 9919
GDP fY 6129 9768 13129 16382 19355 28294 28287 24486 21915 22902
    1000 Persons
Employment Q -13.19 -9.97 -6.48 -2.78 0.81 11.59 9.45 1.88 -3.88 -5.12
Unemployment Ul 7.19 4.99 3.19 1.29 -0.54 -5.96 -4.79 -0.91 2.01 2.61
    Percent of GDP
Pub. budget balance Tfn_o/Y -0.12 -0.13 -0.06 0.00 0.05 0.17 0.11 0.02 -0.04 -0.04
Priv. saving surplus Tfn_hc/Y 0.07 0.04 -0.04 -0.12 -0.17 -0.22 -0.09 0.00 0.01 -0.01
Balance of payments Enl/Y -0.05 -0.09 -0.11 -0.12 -0.12 -0.04 0.02 0.01 -0.03 -0.05
Foreign receivables Wnnb_e/Y 0.24 0.17 0.01 -0.19 -0.41 -1.34 -1.55 -1.30 -1.03 -0.90
Bond debt Wbd_os_z/Y 0.20 0.30 0.34 0.31 0.24 -0.46 -0.99 -1.04 -0.79 -0.50
    Percent
Capital intensity fKn/fX -0.30 -0.44 -0.55 -0.63 -0.69 -0.63 -0.29 0.02 0.16 0.12
Labour intensity hq/fX -0.78 -0.85 -0.90 -0.92 -0.94 -0.90 -0.87 -0.87 -0.91 -0.94
User cost uim -0.40 -0.48 -0.53 -0.57 -0.59 -0.44 -0.15 0.03 0.03 -0.08
Wage lna -0.28 -0.48 -0.61 -0.68 -0.70 -0.13 0.75 1.21 1.11 0.73
Consumption price pcp -0.38 -0.48 -0.56 -0.61 -0.65 -0.56 -0.27 -0.04 0.01 -0.09
Terms of trade bpe -0.29 -0.36 -0.41 -0.44 -0.46 -0.38 -0.16 -0.01 0.00 -0.08
    Percentage-point
Consumption ratio bcp -0.12 -0.11 -0.06 -0.02 0.01 0.01 -0.04 -0.03 0.00 0.03
Wage share byw -0.21 -0.29 -0.33 -0.34 -0.33 -0.10 0.11 0.15 0.06 -0.06

(See details)


Figure 12c. The effect of a permanent increase in labor efficiency, balanced budget


fig_12_1c_zoom38fig_12_2c_zoom38


fig_12_3c_zoom38fig_12_4c_zoom38


fig_12_5c_zoom38fig_12_6c_zoom38


fig_12_7c_zoom38fig_12_8c_zoom38