14. Productivity - labor and capital efficiency

Here the efficiency of capital and labor is increased, which leads to a fall in the demand for both factors. The experiment produces a general reduction in production costs, therefore, a long run gain in foreign trade and domestic production.


hmtoggle_arrow1A. Labor and capital efficiency


The efficiency of labor and capital is permanently raised by 1 percent. (See experiment)


Table 14a. The effect of a permanent increase in labor and capital efficiency

    1. yr 2. yr 3. yr 4. yr 5. yr 10. yr 15. yr 20. yr 25. yr 30. yr
    Million 2010-Dkr.
Priv. consumption fCp -201 536 666 1385 1906 2058 607 1 536 1695
Pub. consumption fCo 798 776 755 736 717 634 567 517 484 464
Investment fI -4133 -5333 -2968 -1358 -201 2352 1986 1385 1328 1542
Export fE 2828 4771 6896 9128 11425 22510 30695 35247 36988 37190
Import fM -2755 -2259 -897 383 1364 4430 5786 6750 7573 8137
GDP fY 1798 2513 5505 8565 11351 21216 25652 27681 28871 29748
    1000 Persons
Employment Q -23.32 -22.87 -20.76 -18.04 -15.12 -2.37 3.72 5.30 4.75 3.26
Unemployment Ul 14.44 13.15 11.84 10.26 8.57 1.27 -2.18 -3.05 -2.72 -1.86
    Percent of GDP
Pub. budget balance Tfn_o/Y -0.08 -0.10 -0.02 0.09 0.19 0.56 0.71 0.77 0.81 0.85
Priv. saving surplus Tfn_hc/Y 0.26 0.29 0.20 0.08 -0.02 -0.21 -0.13 -0.02 0.03 0.03
Balance of payments Enl/Y 0.18 0.20 0.18 0.17 0.18 0.35 0.58 0.75 0.83 0.88
Foreign receivables Wnnb_e/Y 0.73 1.21 1.50 1.74 1.97 3.26 5.16 7.49 9.89 12.20
Bond debt Wbd_os_z/Y 0.23 0.34 0.34 0.25 0.06 -1.84 -4.37 -6.81 -9.02 -11.05
    Percent
Capital intensity fKn/fX 0.05 -0.16 -0.37 -0.55 -0.69 -1.04 -1.09 -1.07 -1.04 -0.98
Labour intensity hq/fX -0.72 -0.83 -0.93 -1.00 -1.05 -1.10 -1.06 -1.02 -1.00 -0.99
User cost uim -0.39 -0.52 -0.65 -0.77 -0.88 -1.24 -1.35 -1.31 -1.21 -1.10
Wage lna -0.36 -0.78 -1.15 -1.48 -1.76 -2.49 -2.45 -2.10 -1.69 -1.36
Consumption price pcp -0.36 -0.53 -0.68 -0.82 -0.96 -1.43 -1.61 -1.61 -1.52 -1.40
Terms of trade bpe -0.28 -0.39 -0.50 -0.59 -0.68 -0.97 -1.06 -1.02 -0.93 -0.85
    Percentage-point
Consumption ratio bcp -0.07 -0.02 -0.03 0.03 0.07 0.14 0.03 -0.08 -0.12 -0.12
Wage share byw -0.33 -0.43 -0.56 -0.66 -0.72 -0.75 -0.57 -0.39 -0.25 -0.17

(See details)


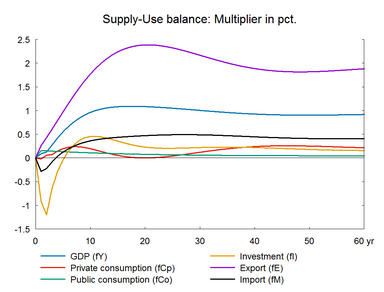
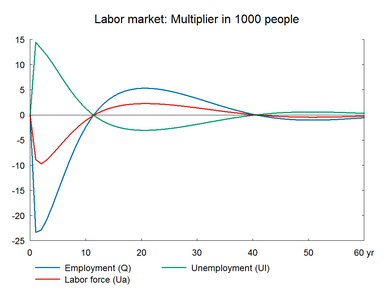
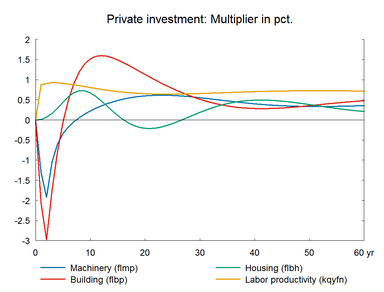
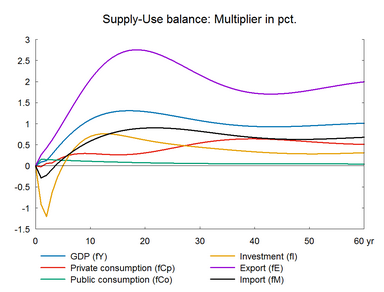
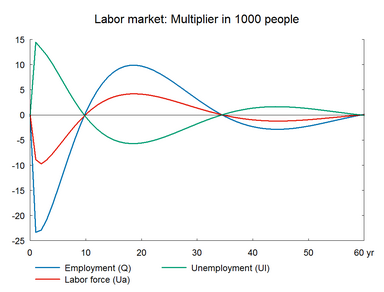
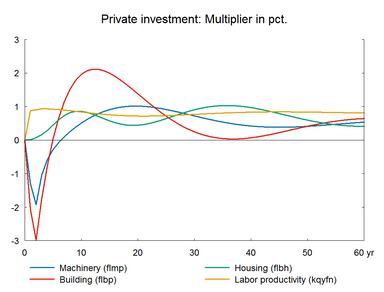
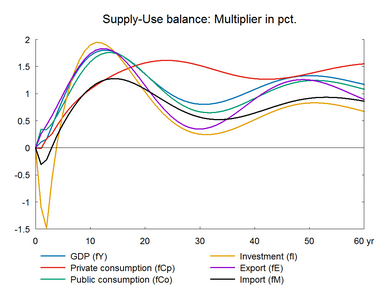
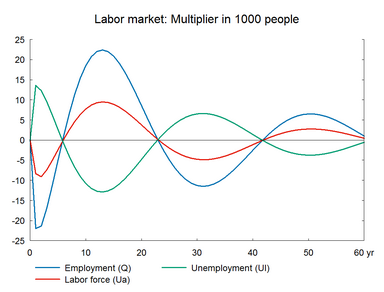
Higher efficiency of labor and capital means that both factor inputs can be reduced, consequently investment and employment fall in the short term. The fall, particularly in machinery investment, reduces imports and depreciation, which increases gross operating surplus. As factors efficiency increases prices fall and net exports increase without relying on change in wages. Higher net exports increase production and employment. This offsets the initial fall in employment created by the increase in labor efficiency.


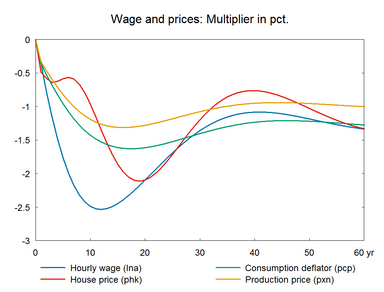
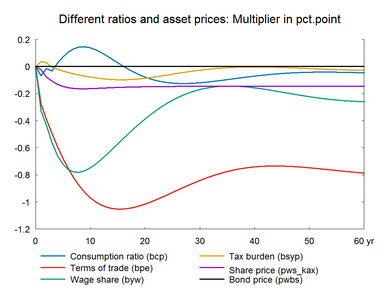
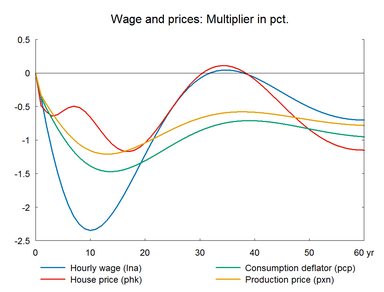
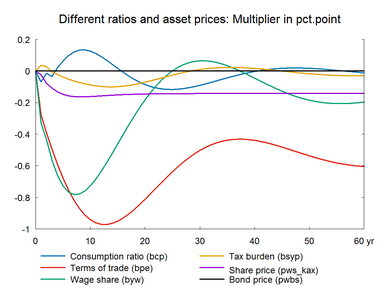
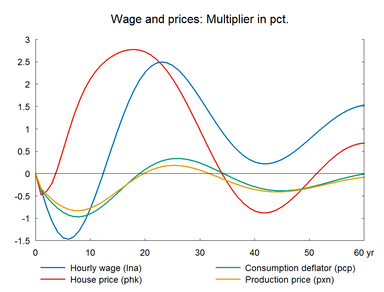
The initial fall in employment pushes wages and prices downward. This improves competitiveness and induce exports to rise even more. As in the previous experiment, the combined effect of higher efficiency and lower wages means that the short-term decrease in factor utilization disappears relatively quickly and the initial negative impact on employment is reversed quickly. In the long term, capital intensity and labor intensity fall by approximately 1 percent, excluding the housing sector.


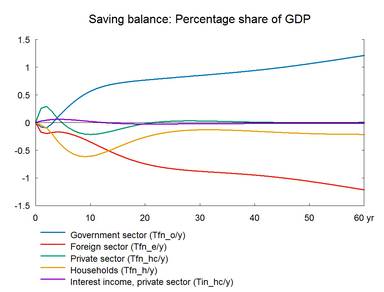
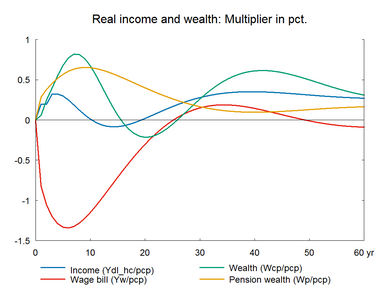
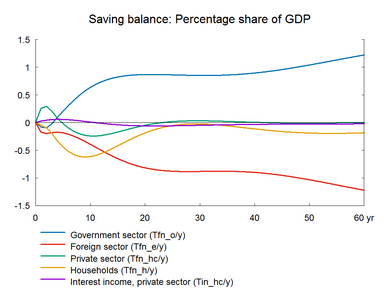
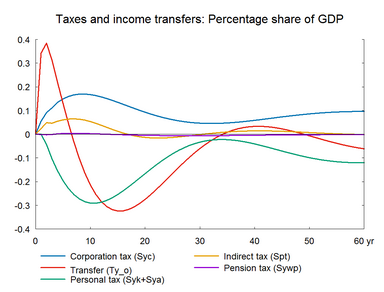
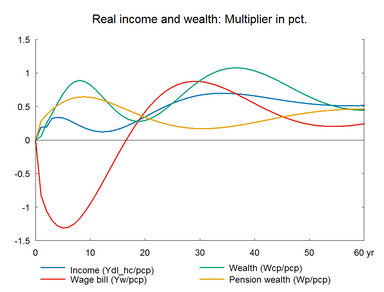
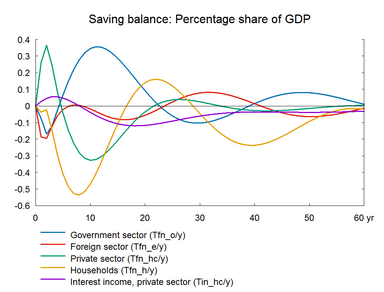
There is a small positive impact on private consumption in the long run, due to the positive impact on real disposable income, which is stimulated as the higher productivity increases the real income of transfer recipients. The public budget improves in the long term.


Figure 14a. The effect of a permanent increase in labor and capital efficiency


fig_14_1a_zoom38fig_14_2a_zoom38


fig_14_3a_zoom38fig_14_4a_zoom38


fig_14_5a_zoom38fig_14_6a_zoom38


fig_14_7a_zoom38fig_14_8a_zoom38

hmtoggle_arrow1B. Labor and capital efficiency - including supply effects on exports


The experiment in section A is repeated accompanied by improved export performance.(See experiment)


Table 14b. The effect of a permanent increase in labor and capital efficiency, with supply effects

    1. yr 2. yr 3. yr 4. yr 5. yr 10. yr 15. yr 20. yr 25. yr 30. yr
    Million 2010-Dkr.
Priv. consumption fCp -201 534 664 1413 2008 3076 2982 3766 5567 7705
Pub. consumption fCo 798 776 755 736 717 632 559 501 459 435
Investment fI -4133 -5343 -2955 -1262 30 3632 4128 3699 3331 3097
Export fE 2828 4736 6957 9441 12122 26056 36289 40463 39807 36997
Import fM -2755 -2282 -862 595 1855 7202 10796 12872 13712 13673
GDP fY 1798 2489 5540 8786 11879 24256 30728 32888 32724 31837
    1000 Persons
Employment Q -23.32 -22.89 -20.73 -17.86 -14.66 0.54 8.54 9.71 7.04 3.12
Unemployment Ul 14.44 13.16 11.83 10.15 8.30 -0.43 -4.95 -5.58 -4.02 -1.76
    Percent of GDP
Pub. budget balance Tfn_o/Y -0.08 -0.10 -0.02 0.10 0.20 0.64 0.82 0.87 0.86 0.85
Priv. saving surplus Tfn_hc/Y 0.26 0.29 0.20 0.08 -0.02 -0.24 -0.17 -0.05 0.02 0.03
Balance of payments Enl/Y 0.18 0.20 0.18 0.17 0.18 0.39 0.65 0.82 0.88 0.88
Foreign receivables Wnnb_e/Y 0.73 1.21 1.50 1.73 1.95 3.17 5.07 7.50 10.01 12.35
Bond debt Wbd_os_z/Y 0.23 0.34 0.34 0.24 0.05 -2.05 -4.97 -7.74 -10.08 -12.01
    Percent
Capital intensity fKn/fX 0.05 -0.16 -0.37 -0.56 -0.71 -1.14 -1.20 -1.09 -0.93 -0.77
Labour intensity hq/fX -0.72 -0.83 -0.93 -1.01 -1.06 -1.15 -1.12 -1.07 -1.04 -1.02
User cost uim -0.39 -0.52 -0.65 -0.76 -0.87 -1.21 -1.24 -1.08 -0.87 -0.70
Wage lna -0.36 -0.78 -1.15 -1.48 -1.75 -2.35 -1.97 -1.22 -0.51 -0.08
Consumption price pcp -0.36 -0.53 -0.68 -0.82 -0.95 -1.39 -1.46 -1.31 -1.07 -0.86
Terms of trade bpe -0.28 -0.39 -0.50 -0.59 -0.68 -0.95 -0.95 -0.82 -0.64 -0.50
    Percentage-point
Consumption ratio bcp -0.07 -0.01 -0.03 0.02 0.06 0.13 0.02 -0.09 -0.12 -0.09
Wage share byw -0.33 -0.43 -0.56 -0.66 -0.73 -0.73 -0.46 -0.18 0.00 0.06

(See details)


Figure 14b. The effect of a permanent increase in labor and capital efficiency, with supply effects


fig_14_1b_zoom38fig_14_2b_zoom38


fig_14_3b_zoom38fig_14_4b_zoom38


fig_14_5b_zoom38fig_14_6b_zoom38


fig_14_7b_zoom38fig_14_8b_zoom38

hmtoggle_arrow1C. Labor and capital efficiency - balanced budget


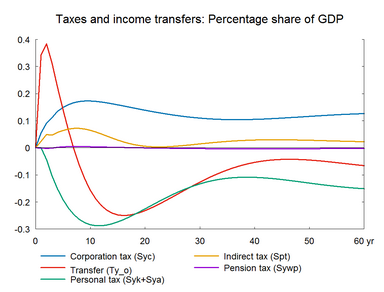
The experiment in section B is repeated, where the income tax rates are reduced to balance the public budget.(See experiment)


Table 14c. The effect of a permanent increase in labor and capital efficiency, with supply effects, balanced budget

    1. yr 2. yr 3. yr 4. yr 5. yr 10. yr 15. yr 20. yr 25. yr 30. yr
    Million 2010-Dkr.
Priv. consumption fCp -134 1550 2448 4086 5601 11413 15711 19200 21258 21600
Pub. consumption fCo 1731 1741 2339 3248 4303 9283 10899 9247 6630 5220
Investment fI -4962 -6583 -2614 572 3079 9858 9578 6228 3113 1756
Export fE 2799 4671 6778 9116 11584 22101 23693 16963 8909 5916
Import fM -2983 -2249 156 2647 4853 13552 16949 15520 12006 9384
GDP fY 2151 3141 8102 13519 18707 37590 41354 34740 26696 23829
    1000 Persons
Employment Q -21.95 -21.35 -16.82 -11.08 -5.02 18.54 20.84 8.57 -4.95 -11.29
Unemployment Ul 13.59 12.27 9.47 6.12 2.62 -10.81 -11.94 -4.80 2.95 6.52
    Percent of GDP
Pub. budget balance Tfn_o/Y -0.07 -0.17 -0.12 -0.02 0.07 0.35 0.29 0.09 -0.06 -0.10
Priv. saving surplus Tfn_hc/Y 0.26 0.36 0.24 0.08 -0.04 -0.33 -0.21 -0.04 0.04 0.02
Balance of payments Enl/Y 0.19 0.20 0.12 0.06 0.02 0.02 0.08 0.06 -0.02 -0.08
Foreign receivables Wnnb_e/Y 0.72 1.17 1.27 1.21 1.07 -0.10 -0.81 -0.79 -0.50 -0.29
Bond debt Wbd_os_z/Y 0.22 0.39 0.47 0.45 0.36 -0.87 -2.07 -2.39 -1.97 -1.33
    Percent
Capital intensity fKn/fX 0.03 -0.20 -0.49 -0.74 -0.94 -1.24 -0.81 -0.22 0.16 0.21
Labour intensity hq/fX -0.68 -0.79 -0.89 -0.96 -0.99 -0.97 -0.90 -0.90 -0.95 -1.01
User cost uim -0.40 -0.55 -0.67 -0.76 -0.82 -0.72 -0.22 0.22 0.35 0.19
Wage lna -0.35 -0.75 -1.07 -1.30 -1.43 -0.78 0.97 2.27 2.42 1.69
Consumption price pcp -0.36 -0.52 -0.66 -0.77 -0.86 -0.90 -0.43 0.09 0.33 0.24
Terms of trade bpe -0.27 -0.39 -0.48 -0.56 -0.61 -0.61 -0.26 0.08 0.21 0.10
    Percentage-point
Consumption ratio bcp -0.07 -0.07 -0.08 -0.01 0.05 0.16 0.09 0.07 0.13 0.20
Wage share byw -0.31 -0.41 -0.52 -0.59 -0.60 -0.22 0.34 0.58 0.44 0.13

(See details)


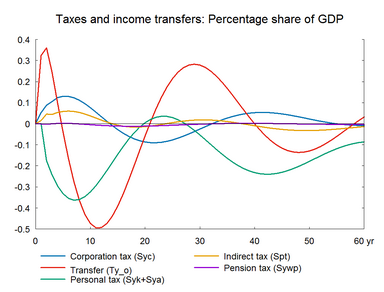
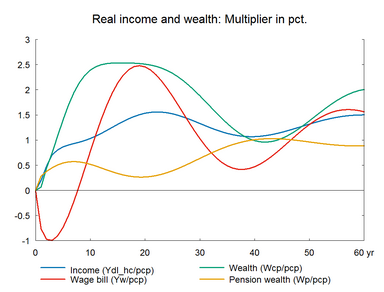
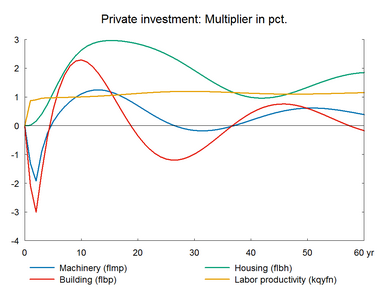
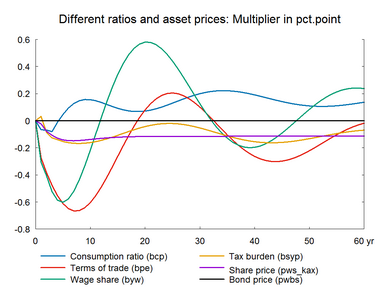
Figure 14c. The effect of a permanent increase in labor and capital efficiency, balanced budget


fig_14_1c_zoom38fig_14_2c_zoom38


fig_14_3c_zoom38fig_14_4c_zoom38


fig_14_5c_zoom38fig_14_6c_zoom38


fig_14_7c_zoom38fig_14_8c_zoom38