14. Productivity - labor and capital efficiency

Here the efficiency of capital and labor is increased, which leads to a fall in the demand for both factors. The experiment produces a general reduction in production costs, therefore, a long run gain in foreign trade and domestic production.


hmtoggle_arrow1A. Labor and capital efficiency


The efficiency of labor and capital is permanently raised by 1 percent. (See experiment)


Table 14a. The effect of a permanent increase in labor and capital efficiency

    1. yr 2. yr 3. yr 4. yr 5. yr 10. yr 15. yr 20. yr 25. yr 30. yr
    Million 2010-Dkr.
Priv. consumption fCp 693 1907 2683 3734 4593 6506 7120 8283 9920 11585
Pub. consumption fCo 5542 5558 5578 5591 5613 5912 6416 6964 7524 8112
Investment fI -1435 -2176 -223 1382 2495 4464 3732 3024 2879 2988
Export fE 3008 4716 6421 8078 9654 15574 17858 17718 16723 15937
Import fM 355 643 1984 3313 4325 6933 7574 7859 8162 8478
GDP fY 7247 8929 11835 14678 17100 24123 25924 26402 27097 28288
    1000 Persons
Employment Q -11.63 -10.75 -8.50 -5.92 -3.42 4.66 5.63 3.88 1.95 0.51
Unemployment Ul 6.34 5.47 4.26 2.94 1.66 -2.41 -2.87 -1.97 -0.98 -0.25
    Percent of GDP
Pub. budget balance Tfn_o/Y -0.23 -0.23 -0.15 -0.06 0.01 0.21 0.19 0.13 0.09 0.07
Priv. saving surplus Tfn_hc/Y 0.22 0.24 0.13 0.02 -0.06 -0.19 -0.09 -0.01 0.01 0.01
Balance of payments Enl/Y -0.01 0.01 -0.02 -0.04 -0.05 0.02 0.10 0.12 0.10 0.08
Foreign receivables Wnnb_e/Y 0.27 0.40 0.38 0.32 0.23 -0.07 0.08 0.48 0.84 1.08
Bond debt Wbd_os_z/Y 0.29 0.51 0.63 0.66 0.63 -0.12 -0.94 -1.42 -1.63 -1.70
    Percent
Capital intensity fKn/fX -0.38 -0.52 -0.67 -0.79 -0.88 -0.93 -0.77 -0.63 -0.54 -0.48
Labour intensity hq/fX -0.78 -0.84 -0.91 -0.96 -0.99 -1.00 -0.97 -0.95 -0.95 -0.96
User cost uim -0.39 -0.46 -0.53 -0.58 -0.63 -0.68 -0.58 -0.45 -0.36 -0.31
Wage lna -0.28 -0.48 -0.64 -0.76 -0.84 -0.78 -0.37 0.01 0.24 0.34
Consumption price pcp -0.40 -0.52 -0.62 -0.70 -0.77 -0.89 -0.82 -0.70 -0.60 -0.53
Terms of trade bpe -0.32 -0.39 -0.46 -0.51 -0.56 -0.63 -0.56 -0.46 -0.39 -0.35
    Percentage-point
Consumption ratio bcp -0.12 -0.07 -0.04 0.01 0.06 0.12 0.06 0.02 0.03 0.05
Wage share byw -0.18 -0.24 -0.29 -0.32 -0.32 -0.19 -0.04 0.05 0.07 0.07

(See details)


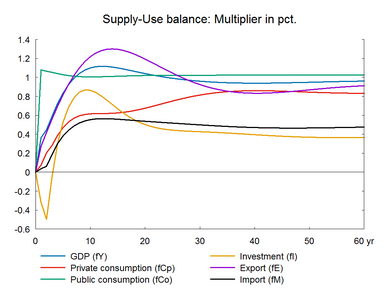
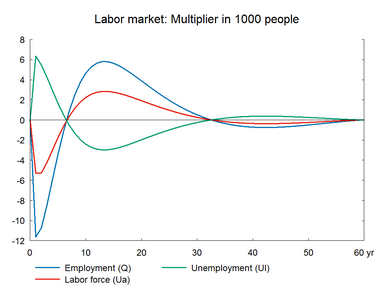
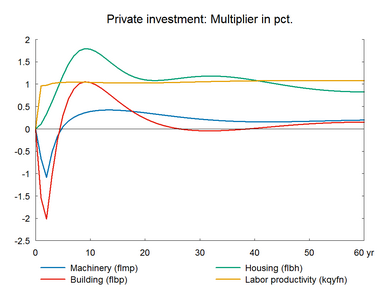
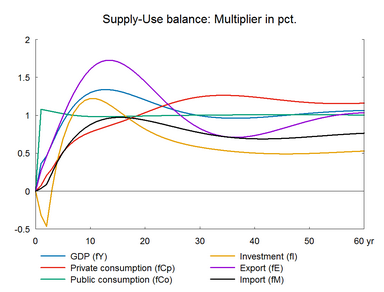
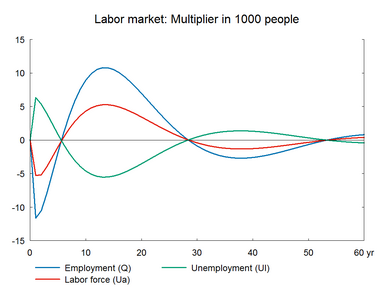
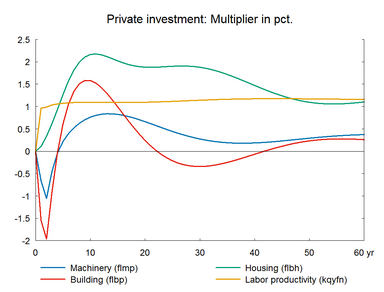
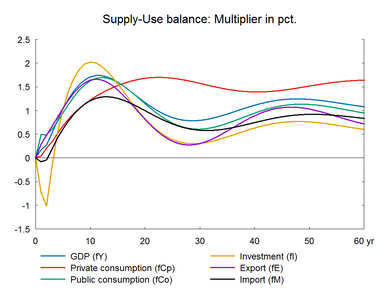
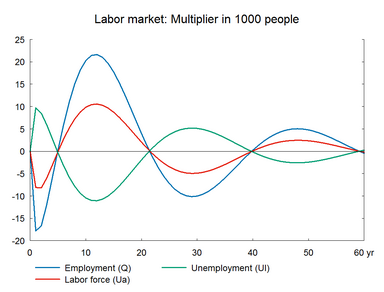
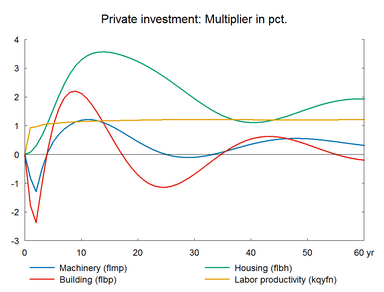
Higher efficiency of labor and capital means that both factor inputs can be reduced, consequently investment and employment fall in the short term. The fall, particularly in machinery investment, reduces imports and depreciation, which increases gross operating surplus. As factors efficiency increases prices fall and net exports increase without relying on change in wages. Higher net exports increase production and employment. This offsets the initial fall in employment created by the increase in labor efficiency.


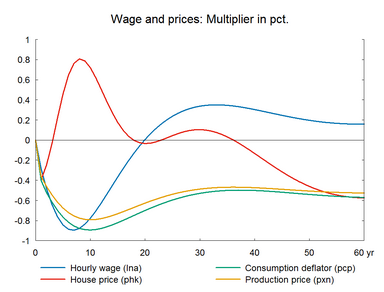
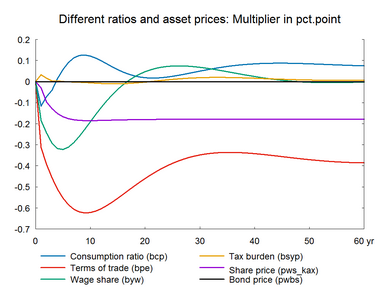
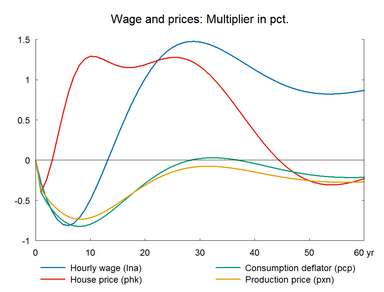
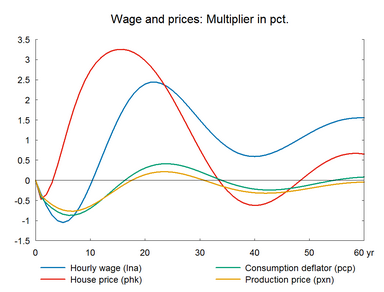
The initial fall in employment pushes wages and prices downward. This improves competitiveness and induce exports to rise even more. As in the previous experiment, the combined effect of higher efficiency and lower wages means that the short-term decrease in factor utilization disappears relatively quickly and the initial negative impact on employment is reversed quickly. In the long term, capital intensity and labor intensity fall by approximately 1 percent, excluding the housing sector.


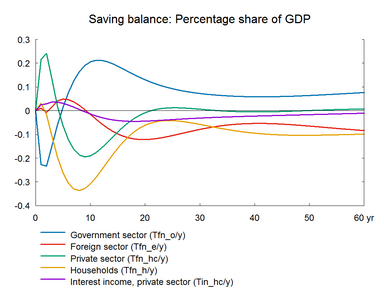
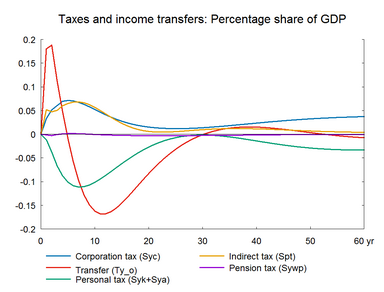
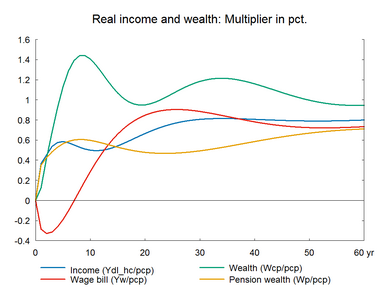
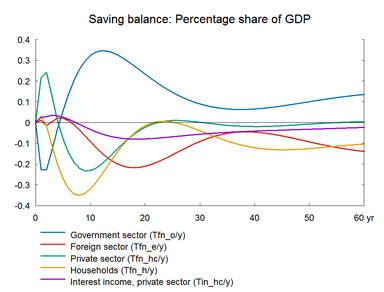
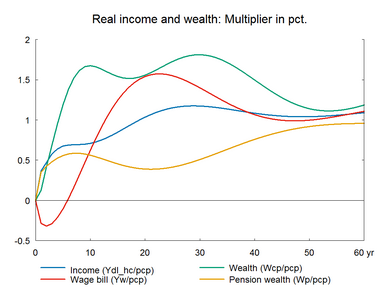
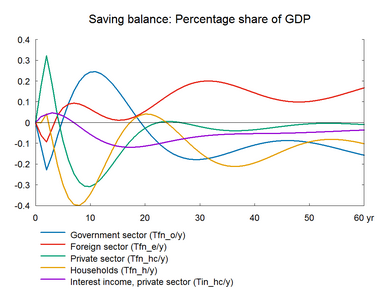
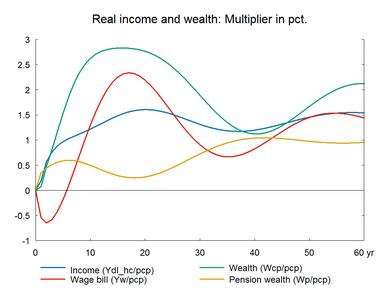
There is a small positive impact on private consumption in the long run, due to the positive impact on real disposable income, which is stimulated as the higher productivity increases the real income of transfer recipients. The public budget improves in the long term.


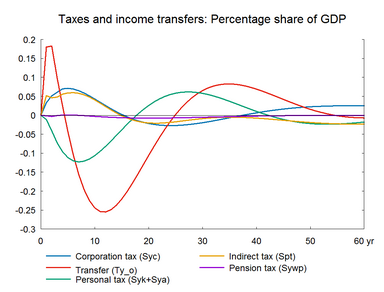
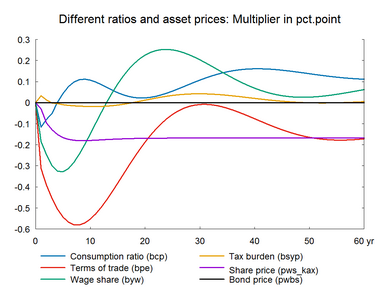
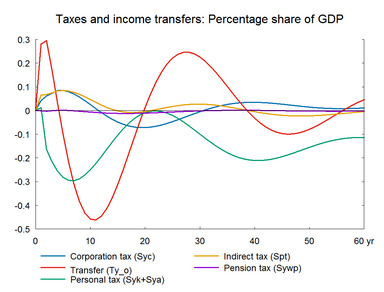
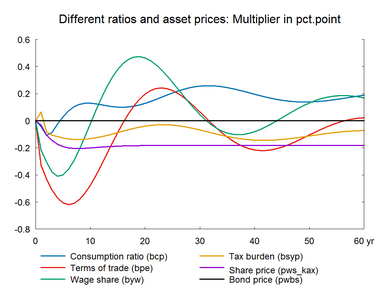
Figure 14a. The effect of a permanent increase in labor and capital efficiency


fig_14_1a_zoom38fig_14_2a_zoom38


fig_14_3a_zoom38fig_14_4a_zoom38


fig_14_5a_zoom38fig_14_6a_zoom38


fig_14_7a_zoom38fig_14_8a_zoom38

hmtoggle_arrow1B. Labor and capital efficiency - including supply effects on exports


The experiment in section A is repeated accompanied by improved export performance.(See experiment)


Table 14b. The effect of a permanent increase in labor and capital efficiency, with supply effects

    1. yr 2. yr 3. yr 4. yr 5. yr 10. yr 15. yr 20. yr 25. yr 30. yr
    Million 2010-Dkr.
Priv. consumption fCp 693 1934 2812 4006 5046 8222 10244 12695 15380 17709
Pub. consumption fCo 5542 5554 5565 5567 5573 5786 6233 6770 7343 7947
Investment fI -1435 -2037 112 1920 3261 6313 5940 4929 4307 4057
Export fE 3008 5126 7289 9500 11699 20567 23511 21429 17432 14247
Import fM 355 900 2583 4322 5807 10979 13189 13687 13438 13084
GDP fY 7247 9236 12542 15860 18821 28482 31134 30527 29461 29323
    1000 Persons
Employment Q -11.63 -10.51 -7.91 -4.88 -1.84 8.95 10.51 6.96 2.47 -0.87
Unemployment Ul 6.34 5.34 3.95 2.39 0.83 -4.62 -5.36 -3.53 -1.23 0.47
    Percent of GDP
Pub. budget balance Tfn_o/Y -0.23 -0.23 -0.13 -0.03 0.06 0.32 0.33 0.23 0.15 0.09
Priv. saving surplus Tfn_hc/Y 0.22 0.24 0.13 0.01 -0.08 -0.23 -0.13 -0.02 0.01 0.00
Balance of payments Enl/Y -0.01 0.01 0.00 -0.02 -0.02 0.09 0.20 0.21 0.16 0.09
Foreign receivables Wnnb_e/Y 0.27 0.39 0.36 0.28 0.18 -0.11 0.23 0.89 1.45 1.74
Bond debt Wbd_os_z/Y 0.29 0.50 0.60 0.60 0.53 -0.61 -1.93 -2.75 -3.05 -3.02
    Percent
Capital intensity fKn/fX -0.38 -0.53 -0.71 -0.84 -0.95 -1.05 -0.82 -0.55 -0.35 -0.23
Labour intensity hq/fX -0.78 -0.85 -0.93 -0.98 -1.02 -1.05 -1.01 -0.98 -0.97 -0.98
User cost uim -0.39 -0.46 -0.53 -0.58 -0.62 -0.61 -0.39 -0.14 0.02 0.09
Wage lna -0.28 -0.48 -0.63 -0.74 -0.80 -0.49 0.31 1.02 1.40 1.47
Consumption price pcp -0.40 -0.52 -0.61 -0.69 -0.75 -0.80 -0.57 -0.29 -0.08 0.02
Terms of trade bpe -0.32 -0.39 -0.46 -0.51 -0.55 -0.56 -0.38 -0.19 -0.06 -0.01
    Percentage-point
Consumption ratio bcp -0.12 -0.08 -0.05 0.00 0.04 0.11 0.05 0.02 0.05 0.11
Wage share byw -0.18 -0.25 -0.30 -0.33 -0.33 -0.15 0.09 0.23 0.25 0.20

(See details)


Figure 14b. The effect of a permanent increase in labor and capital efficiency, with supply effects


fig_14_1b_zoom38fig_14_2b_zoom38


fig_14_3b_zoom38fig_14_4b_zoom38


fig_14_5b_zoom38fig_14_6b_zoom38


fig_14_7b_zoom38fig_14_8b_zoom38

hmtoggle_arrow1C. Labor and capital efficiency - balanced budget


The experiment in section B is repeated, where the income tax rates are reduced to balance the public budget.(See experiment)


Table 14c. The effect of a permanent increase in labor and capital efficiency, with supply effects, balanced budget

    1. yr 2. yr 3. yr 4. yr 5. yr 10. yr 15. yr 20. yr 25. yr 30. yr
    Million 2010-Dkr.
Priv. consumption fCp 361 1944 3233 4981 6636 12952 17403 20635 22247 22410
Pub. consumption fCo 2525 2547 3199 4132 5180 9577 10119 7810 5418 4817
Investment fI -3257 -4432 -824 2427 4893 10455 8741 4977 2507 2150
Export fE 3185 5377 7640 10016 12407 20994 19788 12084 5613 5218
Import fM -809 -429 2003 4628 6949 15133 17046 14593 11317 9925
GDP fY 3427 5424 10592 16115 21217 37504 37661 29705 23303 23355
    1000 Persons
Employment Q -17.80 -16.69 -11.76 -5.77 0.28 20.30 17.71 3.95 -7.23 -10.02
Unemployment Ul 9.71 8.50 5.83 2.74 -0.35 -10.45 -8.99 -1.92 3.75 5.12
    Percent of GDP
Pub. budget balance Tfn_o/Y -0.11 -0.23 -0.16 -0.07 0.02 0.24 0.15 -0.03 -0.15 -0.18
Priv. saving surplus Tfn_hc/Y 0.18 0.32 0.19 0.03 -0.09 -0.31 -0.17 -0.03 0.00 -0.02
Balance of payments Enl/Y 0.06 0.09 0.03 -0.03 -0.07 -0.06 -0.01 -0.05 -0.14 -0.20
Foreign receivables Wnnb_e/Y 0.52 0.79 0.76 0.57 0.30 -1.26 -2.02 -2.06 -2.03 -2.26
Bond debt Wbd_os_z/Y 0.24 0.46 0.57 0.59 0.53 -0.40 -1.19 -1.15 -0.50 0.28
    Percent
Capital intensity fKn/fX -0.24 -0.42 -0.69 -0.92 -1.09 -1.21 -0.66 -0.08 0.20 0.16
Labour intensity hq/fX -0.83 -0.90 -0.98 -1.03 -1.06 -1.00 -0.93 -0.94 -1.00 -1.06
User cost uim -0.44 -0.56 -0.67 -0.74 -0.77 -0.53 -0.01 0.34 0.35 0.13
Wage lna -0.34 -0.64 -0.87 -1.00 -1.05 -0.12 1.50 2.39 2.23 1.50
Consumption price pcp -0.42 -0.57 -0.69 -0.78 -0.84 -0.69 -0.14 0.31 0.40 0.22
Terms of trade bpe -0.33 -0.43 -0.51 -0.57 -0.61 -0.48 -0.09 0.20 0.22 0.06
    Percentage-point
Consumption ratio bcp -0.04 -0.11 -0.09 -0.03 0.03 0.13 0.10 0.13 0.20 0.26
Wage share byw -0.22 -0.31 -0.38 -0.41 -0.40 -0.02 0.38 0.46 0.28 0.04

(See details)


Figure 14c. The effect of a permanent increase in labor and capital efficiency, balanced budget


fig_14_1c_zoom38fig_14_2c_zoom38


fig_14_3c_zoom38fig_14_4c_zoom38


fig_14_5c_zoom38fig_14_6c_zoom38


fig_14_7c_zoom38fig_14_8c_zoom38