13. Productivity - capital efficiency

Improvement in machinery efficiency can raise the production capacity of an economy. Alternatively, the same amount of output can be produced with less capital, which makes production less capital intensive, with the usual measure of capital. If, however, capital is measured in efficiency units, production will become more capital intensive, which raises productivity and production in the long run.


hmtoggle_arrow1A. Capital efficiency


In the following, machinery efficiency is increased by 1 percent permanently. (See experiment)


Table 13a. The effect of a permanent increase in machinery efficiency

    1. yr 2. yr 3. yr 4. yr 5. yr 10. yr 15. yr 20. yr 25. yr 30. yr
    Million 2010-Dkr.
Priv. consumption fCp -2 -379 -453 -204 58 777 961 1202 1563 1933
Pub. consumption fCo 86 79 61 29 -6 -138 -197 -229 -258 -285
Investment fI -2125 -3215 -2268 -1626 -1284 -569 -687 -985 -1191 -1334
Export fE 409 744 1111 1490 1865 3430 4122 4079 3715 3365
Import fM -1532 -2241 -1732 -1266 -978 -260 -147 -229 -349 -485
GDP fY -175 -686 -8 736 1364 3399 3926 3851 3721 3693
    1000 Persons
Employment Q -2.32 -2.96 -2.72 -2.21 -1.62 0.88 1.57 1.22 0.66 0.19
Unemployment Ul 1.26 1.54 1.38 1.11 0.81 -0.46 -0.80 -0.62 -0.33 -0.10
    Percent of GDP
Pub. budget balance Tfn_o/Y 0.03 0.01 0.02 0.04 0.06 0.15 0.17 0.17 0.18 0.19
Priv. saving surplus Tfn_hc/Y 0.06 0.13 0.10 0.06 0.03 -0.03 -0.02 0.00 0.01 0.00
Balance of payments Enl/Y 0.09 0.13 0.12 0.10 0.10 0.12 0.15 0.17 0.18 0.19
Foreign receivables Wnnb_e/Y 0.20 0.41 0.54 0.63 0.72 1.11 1.54 2.04 2.52 2.98
Bond debt Wbd_os_z/Y 0.01 0.02 0.00 -0.04 -0.10 -0.60 -1.21 -1.76 -2.22 -2.63
    Percent
Capital intensity fKn/fX 0.04 0.01 -0.05 -0.09 -0.13 -0.20 -0.18 -0.15 -0.12 -0.10
Labour intensity hq/fX -0.01 -0.02 -0.05 -0.06 -0.07 -0.08 -0.07 -0.06 -0.06 -0.06
User cost uim -0.05 -0.06 -0.08 -0.09 -0.11 -0.14 -0.12 -0.09 -0.06 -0.05
Wage lna -0.04 -0.09 -0.14 -0.18 -0.21 -0.24 -0.14 -0.03 0.04 0.08
Consumption price pcp -0.05 -0.08 -0.10 -0.13 -0.15 -0.20 -0.18 -0.15 -0.12 -0.09
Terms of trade bpe -0.03 -0.06 -0.08 -0.09 -0.11 -0.14 -0.13 -0.10 -0.08 -0.07
    Percentage-point
Consumption ratio bcp 0.05 0.02 0.01 0.02 0.03 0.07 0.06 0.05 0.05 0.06
Wage share byw 0.01 0.01 -0.01 -0.03 -0.03 -0.01 0.04 0.07 0.08 0.08

(See details)


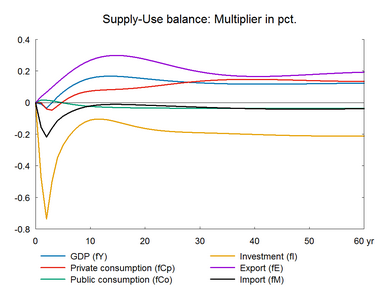
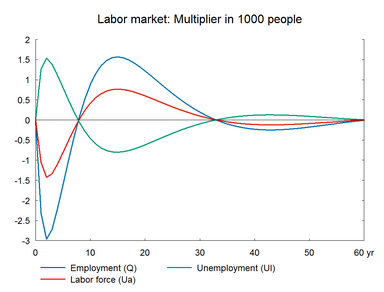
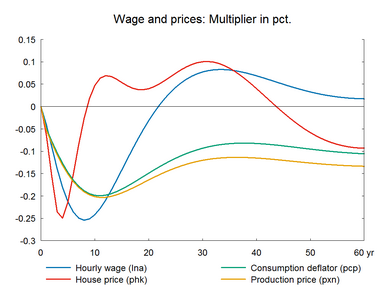
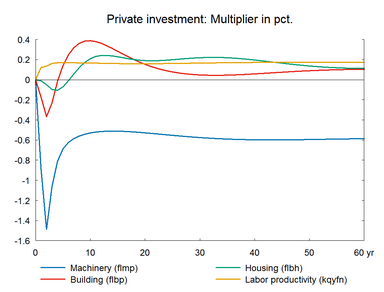
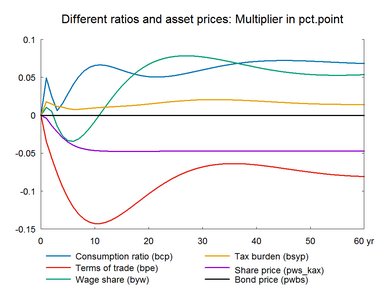
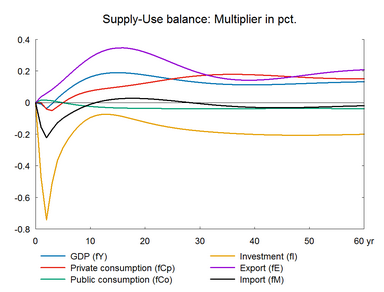
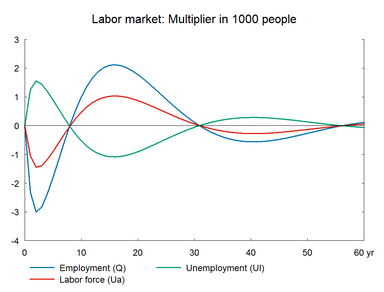
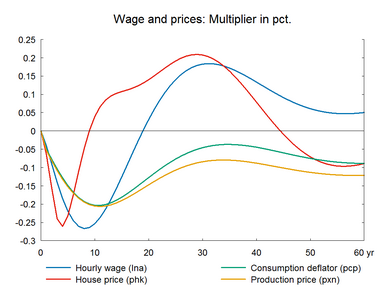
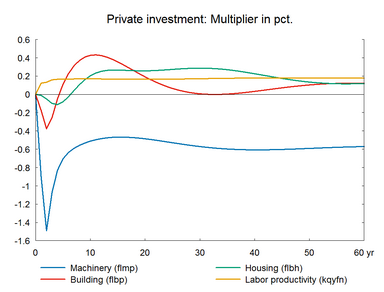
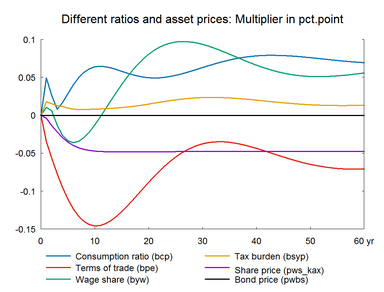
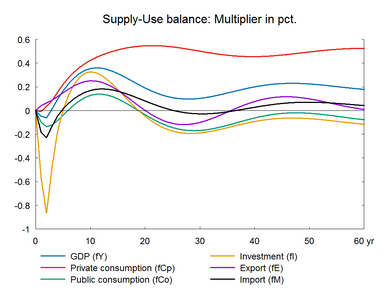
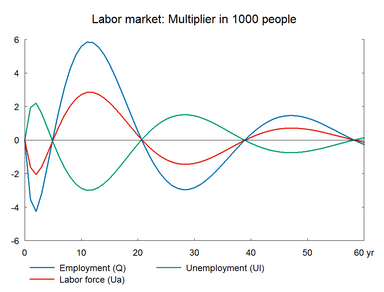
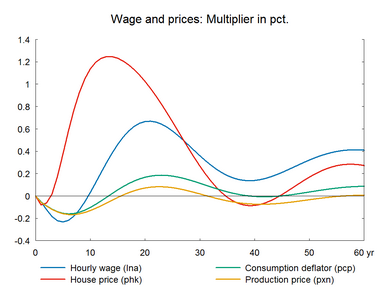
As the efficiency of machines improves, the stock of machinery is reduced, and investment in machinery falls. The lower investment demand reduces production in the short run which further reduces machinery investment. Due to the high import content of machinery investments, imports also fall in the short run. The fall in machinery reduces capital cost and output prices, and the higher unemployment reduces wages. The combined effect is a fall in prices and the price effect occurs relatively quick due to the initial shock to efficiency. As prices fall competitiveness improves and hence exports and production rise. Over time employment returns to the baseline through the wage-driven crowding out. The wage relation in ADAM is a Phillips curve, which links the changes in wages to unemployment. A fall/rise in unemployment pushes wages and hence prices upward/downward and reduces/improves competitiveness. So exports and production decrease/increase and over time unemployment returns to its baseline. This is the wage-driven crowding out process. It may be noted that output per man hour increases in the long term as the higher efficiency of machines induces the substitute of machinery for labor.


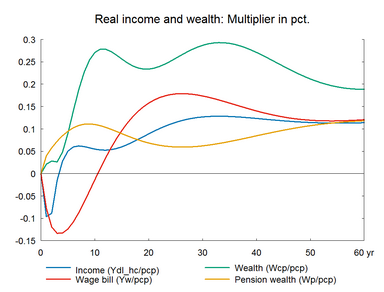
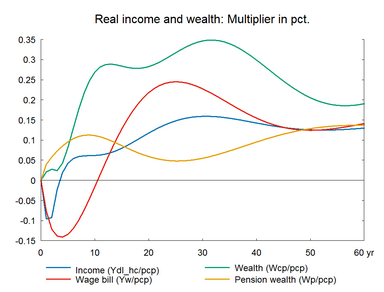
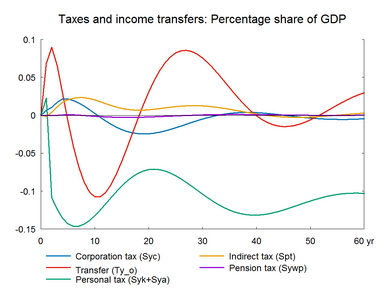
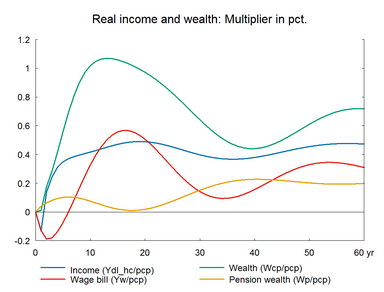
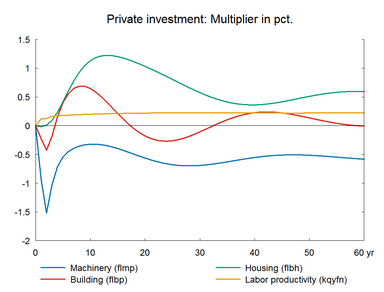
Private consumption falls initially but in the long run it rises. This is because real income falls at first before it permanently increases. It is noted that the higher machinery efficiency will also stimulate the real income of transfer recipients. There is a permanent fall in machinery investment since the lower machinery inventory requires lower reinvestment. In the long run there is a slight positive effect on the nominal wage and a negligible impact on exports.


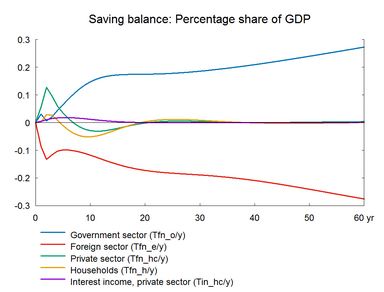
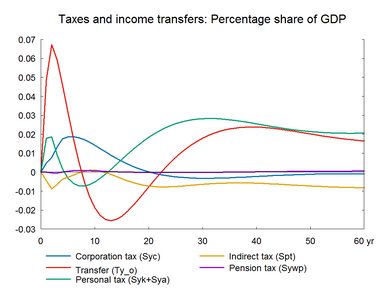
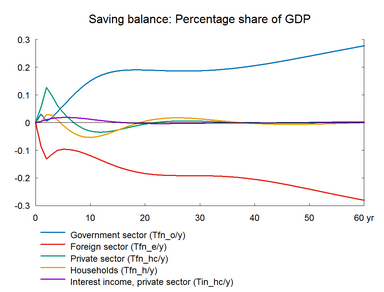
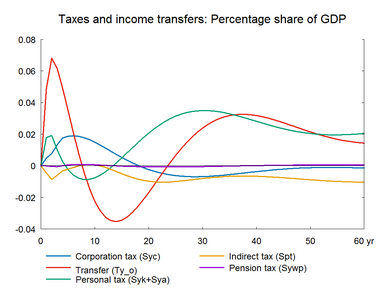
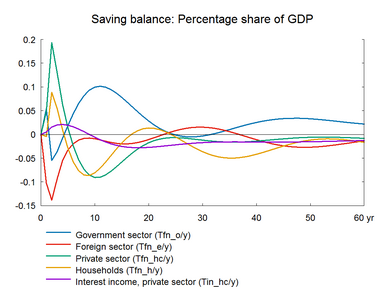
Public finances deteriorate first as transfer payments to the unemployed increase in the short run and improves in the long run.


Figure 13a. The effect of a permanent increase in machinery efficiency


fig_13_1a_zoom38fig_13_2a_zoom38


fig_13_3a_zoom38fig_13_4a_zoom38


fig_13_5a_zoom38fig_13_6a_zoom38


fig_13_7a_zoom38fig_13_8a_zoom38

hmtoggle_arrow1B. Capital efficiency - including supply effects on exports


The experiment in section A is repeated accompanied by improved export performance.(See experiment)


Table 13b. The effect of a permanent increase in machinery efficiency, with supply effects

    1. yr 2. yr 3. yr 4. yr 5. yr 10. yr 15. yr 20. yr 25. yr 30. yr
    Million 2010-Dkr.
Priv. consumption fCp -2 -384 -477 -249 -2 781 1126 1515 1991 2434
Pub. consumption fCo 86 80 63 32 -2 -141 -211 -249 -276 -299
Investment fI -2125 -3241 -2329 -1704 -1356 -487 -454 -744 -1029 -1257
Export fE 409 669 953 1294 1676 3652 4776 4742 4023 3231
Import fM -1532 -2288 -1842 -1410 -1122 -128 328 374 185 -104
GDP fY -175 -742 -137 567 1192 3568 4479 4440 4073 3758
    1000 Persons
Employment Q -2.32 -3.00 -2.83 -2.36 -1.79 1.00 2.10 1.78 0.92 0.12
Unemployment Ul 1.26 1.56 1.44 1.19 0.90 -0.53 -1.08 -0.90 -0.46 -0.05
    Percent of GDP
Pub. budget balance Tfn_o/Y 0.03 0.00 0.02 0.04 0.06 0.15 0.19 0.19 0.19 0.19
Priv. saving surplus Tfn_hc/Y 0.06 0.13 0.10 0.06 0.04 -0.03 -0.03 -0.01 0.00 0.00
Balance of payments Enl/Y 0.09 0.13 0.11 0.10 0.10 0.12 0.16 0.18 0.19 0.19
Foreign receivables Wnnb_e/Y 0.20 0.42 0.54 0.64 0.73 1.09 1.53 2.05 2.57 3.04
Bond debt Wbd_os_z/Y 0.01 0.02 0.00 -0.03 -0.09 -0.59 -1.25 -1.85 -2.34 -2.75
    Percent
Capital intensity fKn/fX 0.04 0.02 -0.04 -0.09 -0.12 -0.21 -0.20 -0.15 -0.11 -0.08
Labour intensity hq/fX -0.01 -0.02 -0.04 -0.06 -0.07 -0.09 -0.08 -0.07 -0.06 -0.06
User cost uim -0.05 -0.06 -0.08 -0.09 -0.11 -0.15 -0.12 -0.07 -0.03 -0.01
Wage lna -0.04 -0.09 -0.14 -0.18 -0.22 -0.25 -0.13 0.03 0.14 0.18
Consumption price pcp -0.05 -0.08 -0.10 -0.13 -0.15 -0.20 -0.18 -0.13 -0.08 -0.05
Terms of trade bpe -0.03 -0.06 -0.08 -0.10 -0.11 -0.15 -0.13 -0.09 -0.06 -0.04
    Percentage-point
Consumption ratio bcp 0.05 0.03 0.01 0.02 0.03 0.06 0.06 0.05 0.05 0.06
Wage share byw 0.01 0.01 -0.01 -0.03 -0.03 -0.01 0.04 0.08 0.10 0.09

(See details)


Figure 13b. The effect of a permanent increase in machinery efficiency, with supply effects


fig_13_1b_zoom38fig_13_2b_zoom38


fig_13_3b_zoom38fig_13_4b_zoom38


fig_13_5b_zoom38fig_13_6b_zoom38


fig_13_7b_zoom38fig_13_8b_zoom38

hmtoggle_arrow1C. Capital efficiency - balanced budget


The experiment in section B is repeated, where the income tax rates are reduced to balance the public budget.(See experiment)


Table 13c. The effect of a permanent increase in machinery efficiency, balanced budget

    1. yr 2. yr 3. yr 4. yr 5. yr 10. yr 15. yr 20. yr 25. yr 30. yr
    Million 2010-Dkr.
Priv. consumption fCp -68 330 785 1484 2158 4475 5831 6707 7101 7139
Pub. consumption fCo -508 -710 -647 -456 -221 752 630 -241 -1057 -1333
Investment fI -2528 -3793 -2171 -847 10 1688 993 -286 -1126 -1326
Export fE 444 716 1007 1368 1769 3214 2351 12 -1738 -1728
Import fM -1798 -2355 -1428 -533 140 2121 2221 1181 42 -474
GDP fY -938 -1239 247 1913 3390 7773 7371 4844 2980 3031
    1000 Persons
Employment Q -3.54 -4.26 -3.17 -1.53 0.15 5.59 4.50 0.52 -2.41 -2.84
Unemployment Ul 1.93 2.20 1.58 0.73 -0.13 -2.88 -2.28 -0.24 1.25 1.45
    Percent of GDP
Pub. budget balance Tfn_o/Y 0.05 -0.05 -0.04 -0.01 0.02 0.10 0.08 0.03 0.00 0.00
Priv. saving surplus Tfn_hc/Y 0.05 0.19 0.13 0.06 0.01 -0.09 -0.06 -0.02 -0.01 -0.01
Balance of payments Enl/Y 0.10 0.14 0.09 0.06 0.03 0.01 0.02 0.01 -0.01 -0.02
Foreign receivables Wnnb_e/Y 0.25 0.48 0.54 0.54 0.50 0.15 -0.02 0.02 0.09 0.10
Bond debt Wbd_os_z/Y 0.00 0.06 0.08 0.08 0.05 -0.31 -0.65 -0.74 -0.65 -0.54
    Percent
Capital intensity fKn/fX 0.07 0.03 -0.06 -0.14 -0.20 -0.23 -0.06 0.11 0.18 0.16
Labour intensity hq/fX -0.02 -0.04 -0.07 -0.09 -0.09 -0.08 -0.06 -0.06 -0.08 -0.10
User cost uim -0.06 -0.09 -0.12 -0.14 -0.15 -0.08 0.06 0.14 0.13 0.06
Wage lna -0.05 -0.12 -0.18 -0.22 -0.23 0.03 0.46 0.67 0.58 0.36
Consumption price pcp -0.05 -0.09 -0.12 -0.14 -0.15 -0.10 0.05 0.17 0.18 0.11
Terms of trade bpe -0.04 -0.06 -0.09 -0.10 -0.12 -0.08 0.03 0.10 0.09 0.04
    Percentage-point
Consumption ratio bcp 0.06 -0.02 -0.02 0.01 0.04 0.10 0.11 0.12 0.14 0.15
Wage share byw 0.00 -0.01 -0.04 -0.05 -0.05 0.06 0.16 0.17 0.11 0.05

(See details)


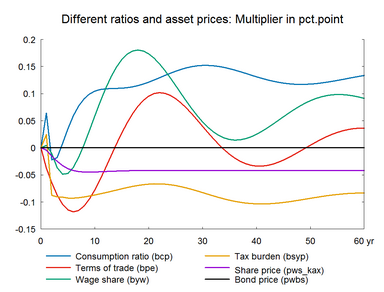
Figure 13c. The effect of a permanent increase in machinery efficiency, balanced budget


fig_13_1c_zoom38fig_13_2c_zoom38


fig_13_3c_zoom38fig_13_4c_zoom38


fig_13_5c_zoom38fig_13_6c_zoom38


fig_13_7c_zoom38fig_13_8c_zoom38