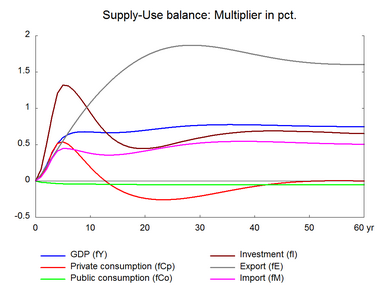
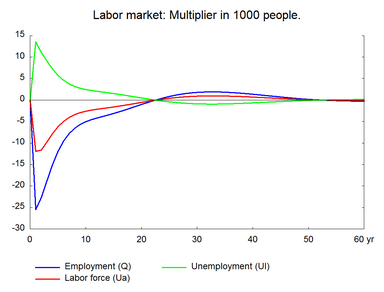
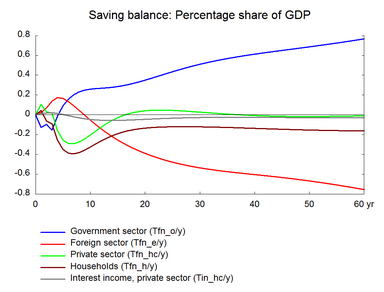
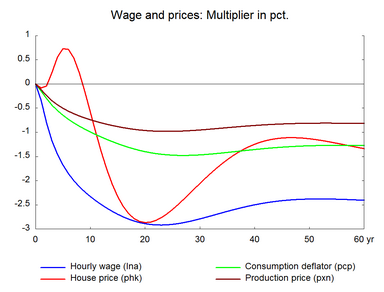
The supply of labor input will also increase if working hours increase. An increase in working hours raises employment in terms of hours and in the short run it reduces the number of workers employed. Table 11 presents the effect of a permanent 1 percent increase in working hours. (See experiment)
Table 11. The effect of a permanent increase in working hours
| 1. yr | 2. yr | 3. yr | 4. yr | 5. yr | 10. yr | 15. yr | 20. yr | 25. yr | 30. yr | ||
| Million 2005-kr. | |||||||||||
| Priv. consumption | fCp | 587 | 1487 | 3207 | 4245 | 4489 | 1706 | -1085 | -2491 | -2853 | -2517 |
| Pub. consumption | fCo | -73 | -98 | -129 | -154 | -170 | -206 | -236 | -275 | -314 | -346 |
| Investment | fI | 551 | 1698 | 3132 | 4339 | 4841 | 3757 | 2314 | 2074 | 2553 | 3210 |
| Export | fE | 819 | 1858 | 3001 | 4117 | 5284 | 11071 | 16209 | 20517 | 23745 | 25844 |
| Import | fM | 475 | 1402 | 2809 | 3816 | 4203 | 3871 | 3955 | 4880 | 6073 | 7162 |
| GDP | fY | 1372 | 3415 | 6157 | 8400 | 9852 | 11977 | 12738 | 14383 | 16431 | 18344 |
| 1000 Persons | |||||||||||
| Employment | Q | -25.47 | -22.66 | -18.84 | -15.06 | -11.94 | -5.03 | -3.11 | -1.03 | 0.83 | 1.79 |
| Unemployment | Ul | 13.53 | 11.03 | 9.08 | 7.24 | 5.73 | 2.45 | 1.51 | 0.49 | -0.42 | -0.88 |
| Percent of GDP | |||||||||||
| Pub. budget balance | Tfn_o/Y | -0.13 | -0.10 | -0.15 | -0.01 | 0.09 | 0.26 | 0.28 | 0.35 | 0.43 | 0.51 |
| Priv. saving surplus | Tfn_hc/Y | 0.10 | 0.03 | 0.02 | -0.16 | -0.26 | -0.20 | -0.03 | 0.04 | 0.04 | 0.03 |
| Balance of payments | Enl/Y | -0.02 | -0.07 | -0.14 | -0.17 | -0.17 | 0.05 | 0.25 | 0.39 | 0.48 | 0.54 |
| Foreign receivables | Wnnb_e/Y | 0.08 | 0.11 | 0.03 | -0.11 | -0.23 | -0.12 | 0.94 | 2.47 | 4.17 | 5.87 |
| Bond debt | Wbd_os_z/Y | 0.19 | 0.32 | 0.47 | 0.48 | 0.41 | -0.50 | -1.53 | -2.64 | -3.93 | -5.36 |
| Percent | |||||||||||
| Capital intensity | fKn/fX | -0.09 | -0.21 | -0.33 | -0.42 | -0.45 | -0.39 | -0.40 | -0.51 | -0.60 | -0.64 |
| Labour intensity | hq/fX | -0.04 | -0.08 | -0.12 | -0.12 | -0.11 | -0.03 | -0.02 | -0.01 | 0.00 | 0.01 |
| User cost | uim | -0.15 | -0.29 | -0.41 | -0.49 | -0.57 | -0.82 | -0.98 | -1.07 | -1.09 | -1.05 |
| Wage | lna | -0.33 | -0.80 | -1.18 | -1.46 | -1.68 | -2.33 | -2.70 | -2.89 | -2.90 | -2.79 |
| Consumption price | pcp | -0.15 | -0.30 | -0.44 | -0.55 | -0.65 | -0.99 | -1.24 | -1.40 | -1.47 | -1.47 |
| Terms of trade | bpe | -0.10 | -0.21 | -0.29 | -0.36 | -0.41 | -0.60 | -0.71 | -0.77 | -0.78 | -0.76 |
| Percentage-point | |||||||||||
| Consumption ratio | bcp | -0.12 | -0.08 | -0.10 | 0.03 | 0.11 | 0.06 | -0.09 | -0.18 | -0.21 | -0.21 |
| Wage share | byw | -0.11 | -0.24 | -0.34 | -0.39 | -0.41 | -0.41 | -0.42 | -0.41 | -0.36 | -0.31 |
When working hours of existing workers increase potential production increases immediately. Compared to the previous experiment the initial reaction via the production function is stronger in the present experiment because the working hours of already employed people increases. In the short run, there is no change in demand, so layoffs are inevitable and employment falls. The rise in unemployment dampens wages and competitiveness improves. Consequently, the wage-driven crowding out returns unemployment to the baseline in the long run.▼ The wage relation in ADAM is a Phillips curve, which links the changes in wages to unemployment. A fall/rise in unemployment pushes wages and hence prices upward/downward and reduces/improves competitiveness. So exports and production decrease/increase and over time unemployment returns to its baseline. This is the wage-driven crowding out process.
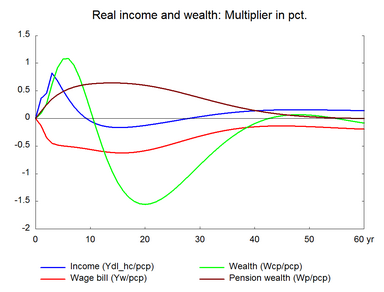
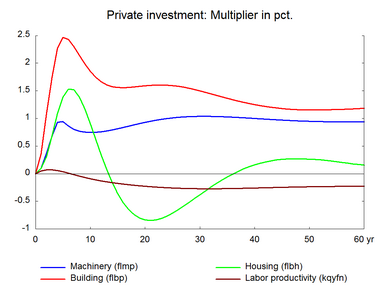
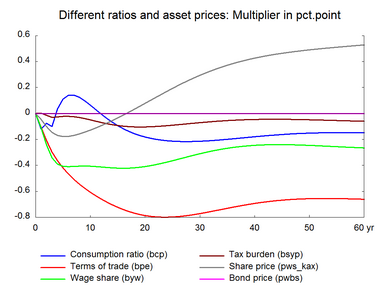
The previous section 10 showed that private consumption falls in the long term when the positive shock to labor input is in number of workers. When working hours increase, there is no fall in private consumption in the long run. Public transfer income is adjusted with the income per worker. Thus, the fall in total real income is smaller than in the previous experiment because the real income of public transfer earners is adjusted upwards with the number of working hours per employed. Transfer income is not adjusted with the number of employed. In this way, the different impact on consumption in experiment 10 and 11 reflects the institutional setup. The marginal increase in disposable income is not enough to raise private consumption in the long run as there is also a fall in real wealth due to a fall in housing wealth. The higher investment raises imports in the long run.
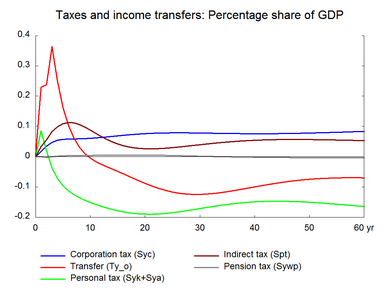
There is a positive effect on the public budget in the long run, because the fall in public expenses is larger than the fall in revenues. Personal income taxes do not fall as much as annual incomes, as the higher working hours offset the fall in annual incomes. Corporate taxes also increase due to the increase in profits. Indirect taxes also contribute to revenue. However, the positive long term effect on the public budget is smaller than in experiment 10 due to the indexation of public transfers.
Figure 11. The effect of a permanent 1 percent increase in working hours
