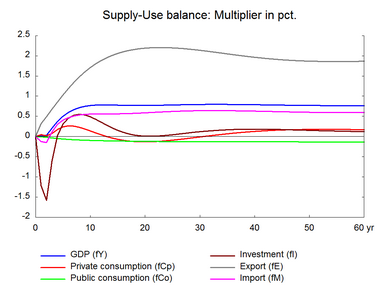
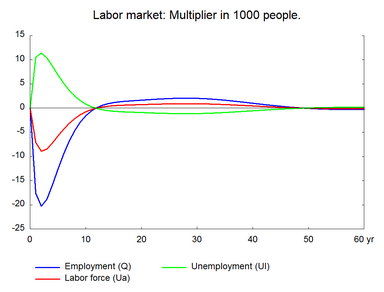
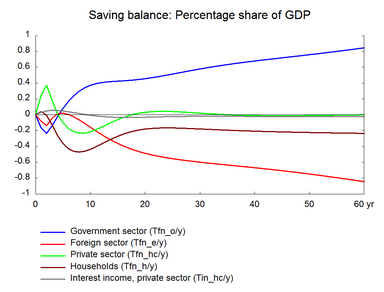
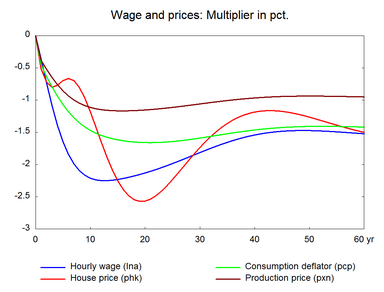
In this supply side shock the efficiency of all factors increase, and the demand for all factors fall. Here, there is no substitution between factors. The experiment produces a general reduction in production costs. Table 14 presents the effect of a permanent 1 per cent increase in the efficiency of all factors. (See experiment)
Table 14. The effect of a permanent increase in the efficiency of all factors.
| 1. yr | 2. yr | 3. yr | 4. yr | 5. yr | 10. yr | 15. yr | 20. yr | 25. yr | 30. yr | ||
| Million 2005-kr. | |||||||||||
| Priv. consumption | fCp | 388 | 157 | 647 | 1498 | 2098 | 1309 | -697 | -1435 | -1054 | -127 |
| Pub. consumption | fCo | -31 | -69 | -148 | -216 | -270 | -451 | -561 | -653 | -739 | -819 |
| Investment | fI | -4146 | -5304 | -2114 | 86 | 1130 | 1945 | 663 | 44 | 221 | 648 |
| Export | fE | 2830 | 4458 | 6246 | 7986 | 9759 | 17469 | 22675 | 25973 | 28068 | 29403 |
| Import | fM | -1075 | -1308 | 1040 | 2807 | 3832 | 5690 | 6200 | 6973 | 7946 | 8824 |
| GDP | fY | 138 | 517 | 3380 | 6201 | 8435 | 13905 | 15148 | 16175 | 17705 | 19368 |
| 1000 Persons | |||||||||||
| Employment | Q | -17.61 | -20.29 | -18.85 | -15.87 | -12.61 | -1.57 | 1.14 | 1.64 | 1.98 | 2.02 |
| Unemployment | Ul | 10.51 | 11.37 | 10.39 | 8.68 | 6.86 | 0.81 | -0.64 | -0.91 | -1.10 | -1.12 |
| Percent of GDP | |||||||||||
| Pub. budget balance | Tfn_o/Y | -0.16 | -0.24 | -0.14 | -0.02 | 0.08 | 0.37 | 0.42 | 0.46 | 0.51 | 0.58 |
| Priv. saving surplus | Tfn_hc/Y | 0.24 | 0.37 | 0.19 | 0.01 | -0.10 | -0.22 | -0.06 | 0.03 | 0.04 | 0.02 |
| Balance of payments | Enl/Y | 0.08 | 0.14 | 0.05 | -0.01 | -0.02 | 0.16 | 0.36 | 0.49 | 0.55 | 0.60 |
| Foreign receivables | Wnnb_e/Y | 0.55 | 0.88 | 0.95 | 0.94 | 0.93 | 1.25 | 2.45 | 4.14 | 5.95 | 7.71 |
| Bond debt | Wbd_os_z/Y | 0.41 | 0.69 | 0.81 | 0.81 | 0.71 | -0.68 | -2.44 | -4.09 | -5.71 | -7.34 |
| Percent | |||||||||||
| Capital intensity | fKn/fX | -0.13 | -0.29 | -0.51 | -0.69 | -0.81 | -0.99 | -0.98 | -1.00 | -1.04 | -1.04 |
| Labour intensity | hq/fX | -0.69 | -0.85 | -0.99 | -1.07 | -1.10 | -1.07 | -1.04 | -1.03 | -1.02 | -1.02 |
| User cost | uim | -0.44 | -0.59 | -0.73 | -0.84 | -0.93 | -1.16 | -1.21 | -1.19 | -1.15 | -1.09 |
| Wage | lna | -0.36 | -0.73 | -1.09 | -1.39 | -1.65 | -2.21 | -2.23 | -2.13 | -1.98 | -1.81 |
| Consumption price | pcp | -0.45 | -0.63 | -0.79 | -0.94 | -1.07 | -1.47 | -1.62 | -1.66 | -1.64 | -1.59 |
| Terms of trade | bpe | -0.33 | -0.44 | -0.54 | -0.63 | -0.70 | -0.89 | -0.93 | -0.91 | -0.88 | -0.84 |
| Percentage-point | |||||||||||
| Consumption ratio | bcp | 0.02 | -0.06 | -0.05 | 0.02 | 0.09 | 0.13 | -0.01 | -0.10 | -0.12 | -0.10 |
| Wage ratio | byw | -0.14 | -0.29 | -0.42 | -0.50 | -0.54 | -0.49 | -0.39 | -0.32 | -0.27 | -0.23 |
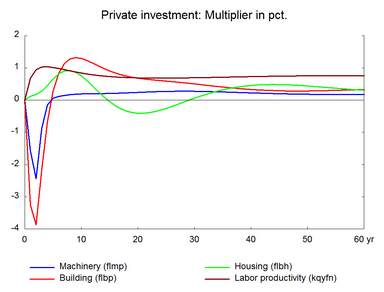
In this case all five factor inputs are made more efficient. Higher efficiency of factors means that factor inputs can be reduced, consequently investment and employment fall in the short term. The fall, particularly in machinery investment, reduces imports and depreciation, which increases gross operating surplus. As factors efficiency increase prices fall and net exports increase without relying on change in wages. Higher net exports increase production and employment. This offsets the initial fall in employment created by the increase in labor efficiency.
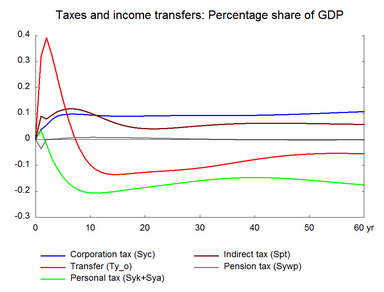
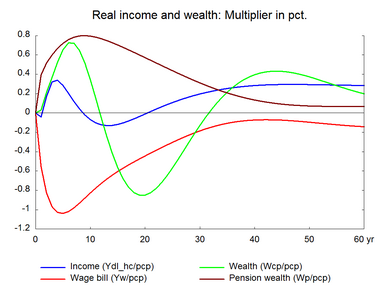
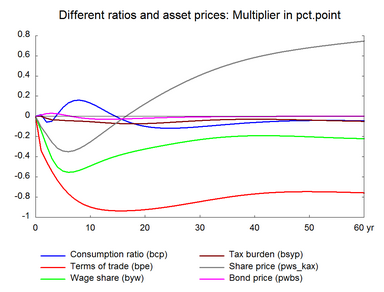
The initial fall in employment pushes wages and prices further downward. This improves competitiveness and induce exports to rise even more. As in the previous experiments, this means that the short-term decrease in factor utilization gradually disappears. In the long term, capital intensity and labor intensity fall by approximately 1 per cent, excluding the housing sector. Real wages increase by less than 1 per cent in the long run, due to among others, the unchanged import prices and taxes that offset the fall in consumption price. Private consumption increases permanently in the long run, due to the permanent increase in real wages and real disposable income, which is stimulated as the higher productivity increases the real income of transfer recipients. The public budget improves in the long term. The experiment can be seen as a permanent supply shock that lifts the output produced by the labor force, which is unaffected in the long term.
Figure 14. The effect of a permanent 1 per cent increase in the efficiency of all factors
