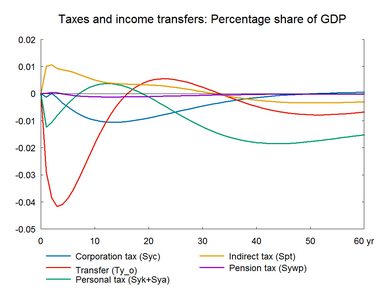
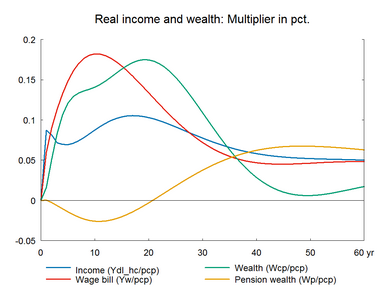
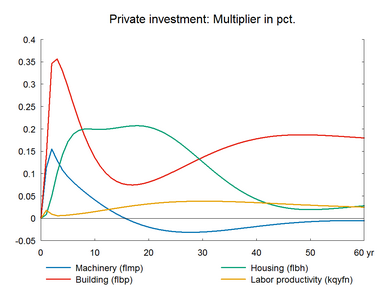
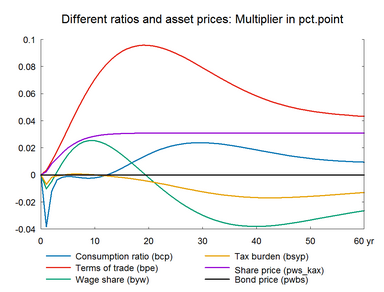
Government investment in buildings, and capital in general, are often used to boost demand in economic slowdowns. The labor content in this investment category is very high. The following two sections demonstrate the effect of unfinanced and financed public investment in buildings.
Government investment in buildings are increased permanently by 0.1 percent of GDP in 2010 prices.(See experiment)
Table 3. The effect of a permanent increase in public investment in buildings
| 1. yr | 2. yr | 3. yr | 4. yr | 5. yr | 10. yr | 15. yr | 20. yr | 25. yr | 30. yr | ||
| Million 2010-Dkr. | |||||||||||
| Priv. consumption | fCp | 95 | 421 | 533 | 595 | 641 | 856 | 1146 | 1383 | 1496 | 1497 |
| Pub. consumption | fCo | -14 | 114 | 240 | 365 | 486 | 1027 | 1456 | 1795 | 2063 | 2276 |
| Investment | fI | 2292 | 2472 | 2452 | 2443 | 2438 | 2306 | 2231 | 2221 | 2206 | 2174 |
| Export | fE | -44 | -126 | -237 | -371 | -524 | -1470 | -2407 | -3074 | -3408 | -3462 |
| Import | fM | 711 | 941 | 969 | 983 | 993 | 914 | 814 | 734 | 672 | 636 |
| GDP | fY | 1634 | 1971 | 2063 | 2105 | 2117 | 1937 | 1795 | 1805 | 1917 | 2089 |
| 1000 Persons | |||||||||||
| Employment | Q | 1.49 | 1.84 | 1.96 | 1.97 | 1.91 | 1.07 | 0.22 | -0.29 | -0.50 | -0.51 |
| Unemployment | Ul | -0.81 | -0.95 | -1.01 | -1.01 | -0.98 | -0.54 | -0.11 | 0.15 | 0.26 | 0.26 |
| Percent of GDP | |||||||||||
| Pub. budget balance | Tfn_o/Y | -0.06 | -0.05 | -0.05 | -0.05 | -0.05 | -0.09 | -0.12 | -0.15 | -0.16 | -0.17 |
| Priv. saving surplus | Tfn_hc/Y | 0.02 | -0.01 | -0.02 | -0.02 | -0.01 | 0.00 | 0.00 | 0.00 | -0.01 | -0.01 |
| Balance of payments | Enl/Y | -0.04 | -0.06 | -0.06 | -0.06 | -0.07 | -0.09 | -0.12 | -0.15 | -0.17 | -0.18 |
| Foreign receivables | Wnnb_e/Y | -0.11 | -0.21 | -0.30 | -0.38 | -0.47 | -0.89 | -1.31 | -1.77 | -2.23 | -2.68 |
| Bond debt | Wbd_os_z/Y | 0.03 | 0.07 | 0.10 | 0.14 | 0.19 | 0.49 | 0.90 | 1.34 | 1.79 | 2.21 |
| Percent | |||||||||||
| Capital intensity | fKn/fX | -0.05 | -0.03 | 0.00 | 0.04 | 0.07 | 0.19 | 0.27 | 0.31 | 0.33 | 0.33 |
| Labour intensity | hq/fX | -0.03 | -0.03 | -0.02 | -0.02 | -0.02 | -0.02 | -0.03 | -0.04 | -0.05 | -0.05 |
| User cost | uim | 0.00 | 0.01 | 0.02 | 0.03 | 0.04 | 0.09 | 0.13 | 0.14 | 0.13 | 0.12 |
| Wage | lna | 0.01 | 0.04 | 0.07 | 0.10 | 0.13 | 0.26 | 0.31 | 0.31 | 0.27 | 0.23 |
| Consumption price | pcp | 0.00 | 0.01 | 0.02 | 0.04 | 0.05 | 0.10 | 0.14 | 0.15 | 0.15 | 0.14 |
| Terms of trade | bpe | 0.00 | 0.01 | 0.02 | 0.03 | 0.03 | 0.07 | 0.09 | 0.10 | 0.09 | 0.08 |
| Percentage-point | |||||||||||
| Consumption ratio | bcp | -0.04 | -0.01 | 0.00 | 0.00 | 0.00 | 0.00 | 0.00 | 0.02 | 0.02 | 0.02 |
| Wage share | byw | -0.01 | 0.00 | 0.00 | 0.01 | 0.01 | 0.03 | 0.01 | 0.00 | -0.02 | -0.03 |
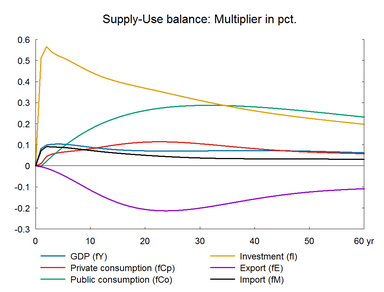
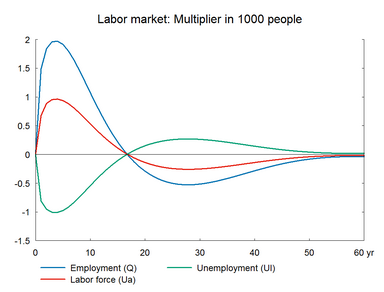
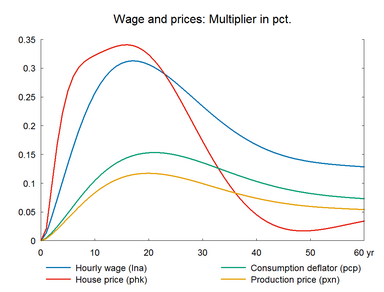
The higher public investment raises private sector production and employment in the short run. The income multiplier expands final demand more than the initial change in investments.▼ In Keynesian economic theory, the income multiplier refers to the final change in income as compared to the injection of capital deposits or investments which originally fueled the growth. It is usually used as a measurement of the effects of government spending on income. In the present experiment, the income multiplier can be seen as the ratio between the effects on final demand and the change in government investment in buildings. Compared to the government purchase of goods and services experiment, the effect on the domestic economy is larger because the import content of building investments is low. In the medium term, the higher employment increases wage growth and the wage-driven crowding out returns unemployment to its baseline in the long run.▼ The wage relation in ADAM is a Phillips curve, which links the changes in wages to unemployment. A fall/rise in unemployment pushes wages and hence prices upward/downward and reduces/improves competitiveness. So exports and production decrease/increase and over time unemployment returns to its baseline. This is the wage-driven crowding out process.
The expansionary nature of public investment raises production in the short run. The higher production requires an equivalent increase in capital. A given change in capital requires a more than proportional change in investment because capital stock is far larger than annual investment. As a result, the impact on investment peaks strongly in the short run. This is the accelerator effect.
Private consumption increases permanently relative to the baseline due to the positive real wage effect.▼ Real wage effect arises because wages increase/decrease more than the general price levels due to the deadweight from the non-responding exogenous import prices. This creates a positive/negative real wage effect and real disposable income and private consumption increase/decrease permanently.
There is a small positive effect on production in the long run due to a substitution effect. A substitution effect arises when a change in the relative prices of factors induces producers to use more of a relatively cheaper factor and less of a relatively more expensive factor. In the present case, the relative price of capital falls due to the import content in investments. This leads to an increase in the capital intensity of production and hence labor productivity increases. Consequently, the same workforce can produce a higher output. In general, there are some long run effects on production due to factor substitution in most of the demand shocks, usually the substitution effects are smaller. For more about substitution and relative factor prices see the supply side experiments from section 10 onwards.
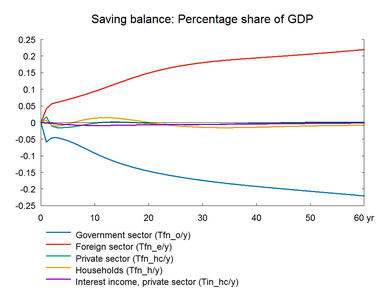
A permanent increase in public investments can deteriorate the government budget permanently, which may require other fiscal measures, e.g. a tax increase on higher public investment in recession may be financed by lower public investments during economic booms.
Figure 3. The effect of a permanent increase in public investment in buildings
