The output capacity of the economy can increase if the efficiency of machines increases. An increase in machinery efficiency reduces the need for capital. This will make production less capital intensive with the usual measure of capital. If, however, capital is measured in efficiency units, production will become more capital intensive, which raises productivity and production in the long run. In the following, machinery efficiency is increased by 1 percent permanently. (See experiment)
Table 13. The effect of a permanent increase in machinery efficiency
| 1. yr | 2. yr | 3. yr | 4. yr | 5. yr | 10. yr | 15. yr | 20. yr | 25. yr | 30. yr | ||
| Million 2005-kr. | |||||||||||
| Priv. consumption | fCp | 23 | -131 | -70 | 316 | 617 | 1060 | 1317 | 1671 | 2020 | 2300 |
| Pub. consumption | fCo | 0 | -23 | -43 | -60 | -75 | -124 | -152 | -171 | -188 | -203 |
| Investment | fI | -2488 | -3495 | -1927 | -1008 | -720 | -591 | -810 | -991 | -1125 | -1252 |
| Export | fE | 233 | 421 | 615 | 784 | 942 | 1390 | 1296 | 948 | 595 | 359 |
| Import | fM | -1330 | -1887 | -888 | -196 | 74 | 300 | 240 | 162 | 83 | 11 |
| GDP | fY | -830 | -1247 | -496 | 237 | 683 | 1400 | 1380 | 1272 | 1200 | 1177 |
| 1000 Persons | |||||||||||
| Employment | Q | -1,14 | -1,87 | -1,51 | -0,78 | -0,12 | 1,36 | 1,19 | 0,68 | 0,26 | 0,00 |
| Unemployment | Ul | 0,60 | 0,95 | 0,73 | 0,36 | 0,04 | -0,68 | -0,58 | -0,33 | -0,13 | 0,00 |
| Percent of GDP | |||||||||||
| Pub. budget balance | Tfn_o/Y | -0,02 | -0,04 | -0,02 | 0,01 | 0,03 | 0,07 | 0,06 | 0,05 | 0,04 | 0,04 |
| Priv. saving surplus | Tfn_hc/Y | 0,11 | 0,18 | 0,10 | 0,03 | 0,00 | -0,03 | -0,01 | 0,00 | 0,00 | 0,00 |
| Balance of payments | Enl/Y | 0,09 | 0,13 | 0,08 | 0,04 | 0,03 | 0,04 | 0,05 | 0,05 | 0,04 | 0,04 |
| Foreign receivables | Wnnb_e/Y | 0,14 | 0,31 | 0,37 | 0,38 | 0,39 | 0,44 | 0,55 | 0,67 | 0,76 | 0,82 |
| Bond debt | Wbd_os_z/Y | 0,05 | 0,10 | 0,12 | 0,10 | 0,07 | -0,20 | -0,45 | -0,60 | -0,70 | -0,76 |
| Percent | |||||||||||
| Capital intensity | fKn/fX | 0,00 | -0,04 | -0,11 | -0,16 | -0,18 | -0,18 | -0,14 | -0,11 | -0,09 | -0,08 |
| Labour intensity | hq/fX | 0,00 | -0,01 | -0,04 | -0,06 | -0,06 | -0,05 | -0,05 | -0,05 | -0,05 | -0,05 |
| User cost | uim | -0,03 | -0,05 | -0,08 | -0,09 | -0,09 | -0,08 | -0,05 | -0,02 | -0,01 | 0,00 |
| Wage | lna | -0,03 | -0,06 | -0,10 | -0,12 | -0,13 | -0,05 | 0,06 | 0,14 | 0,19 | 0,20 |
| Consumption price | pcp | -0,03 | -0,05 | -0,07 | -0,08 | -0,09 | -0,09 | -0,06 | -0,02 | 0,00 | 0,02 |
| Terms of trade | bpe | -0,02 | -0,03 | -0,05 | -0,06 | -0,06 | -0,06 | -0,04 | -0,02 | 0,00 | 0,00 |
| Percentage-point | |||||||||||
| Consumption ratio | bcp | 0,04 | 0,02 | 0,01 | 0,03 | 0,05 | 0,07 | 0,07 | 0,07 | 0,07 | 0,08 |
| Wage share | byw | 0,01 | 0,00 | -0,02 | -0,02 | -0,02 | 0,03 | 0,06 | 0,07 | 0,07 | 0,07 |
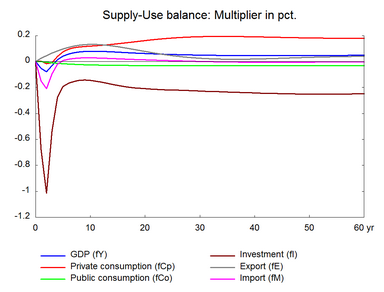
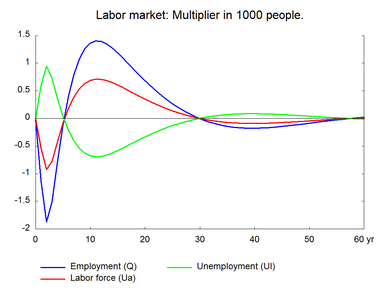
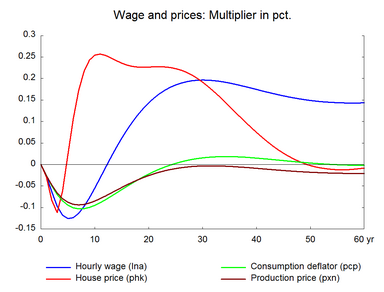
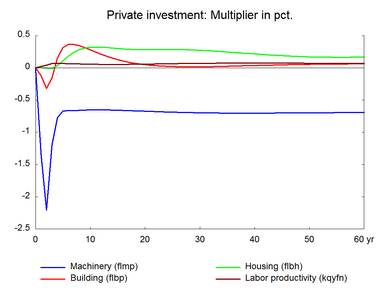
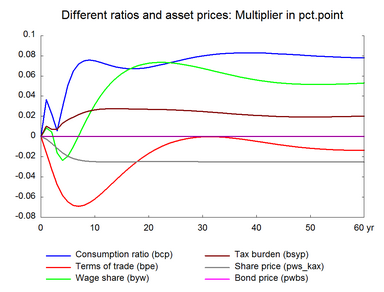
As the efficiency of machines improves, the stock of machinery is reduced, and investment in machinery falls. The lower investment demand reduces production in the short run which further reduces machinery investment. Due to the high import content of machinery investments, imports also fall in the short run. The fall in machinery reduces capital cost and output prices, and the higher unemployment reduces wages. The combined effect is a fall in prices and the price effect occurs relatively quick due to the initial shock to efficiency. As prices fall competitiveness improves and hence exports and production rise. Over time employment returns to the baseline through the wage-driven crowding out.▼ The wage relation in ADAM is a Phillips curve, which links the changes in wages to unemployment. A fall/rise in unemployment pushes wages and hence prices upward/downward and reduces/improves competitiveness. So exports and production decrease/increase and over time unemployment returns to its baseline. This is the wage-driven crowding out process. It may be noted that output per man hour increases in the long term as the higher efficiency of machines induces the substitute of machinery for labor.
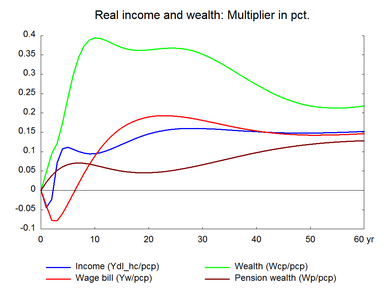
Private consumption falls initially but in the long run it rises. This is because real income falls at first before it permanently increases. It is noted that the higher machinery efficiency will also stimulate the real income of transfer recipients. There is a permanent fall in machinery investment since the lower machinery inventory requires lower reinvestment. In the long run there is a slight positive effect on the nominal wage and a negligible impact on exports.
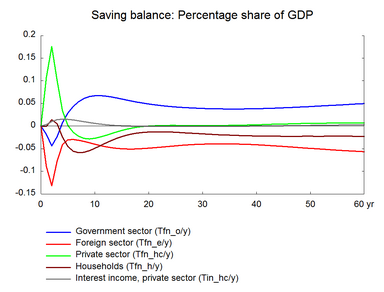
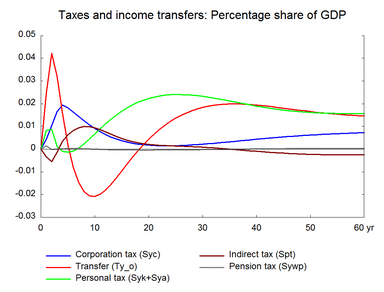
Public finances deteriorate first as transfer payments to the unemployed increase in the short run and improves in the long run.
Figure 13. The effect of a permanent 1 percent increase in machinery efficiency
