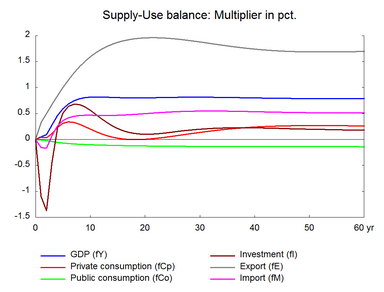
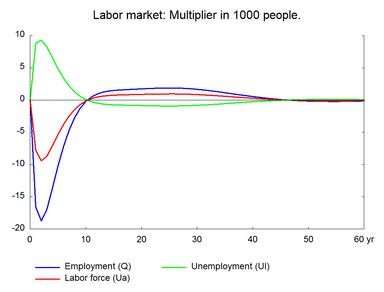
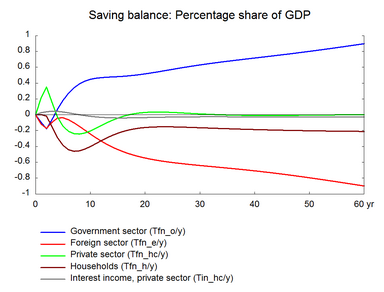
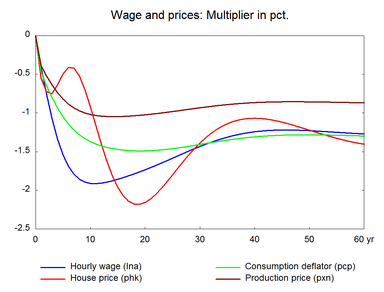
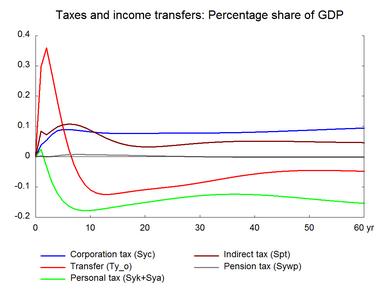
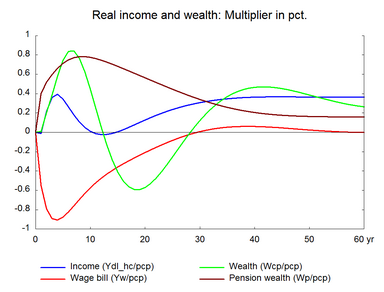
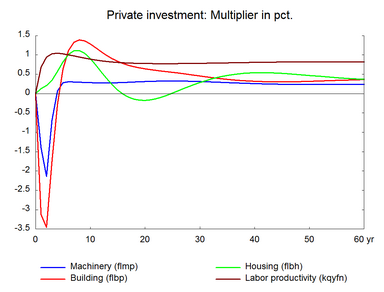
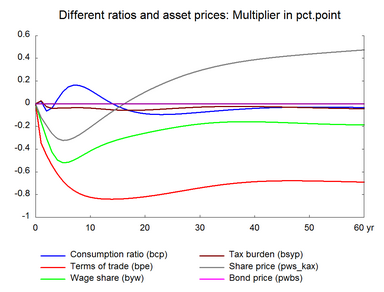
In this supply side shock the efficiency of all factors increases, and the demand for all factors falls. Here, there is no substitution between factors. The experiment produces a general reduction in production costs, therefore, a long run gain in foreign trade and domestic production. Table 14 presents the effect of a permanent 1 percent increase in the efficiency of all factors.(See experiment)
Table 14. The effect of a permanent increase in labor and capital efficiency
| 1. yr | 2. yr | 3. yr | 4. yr | 5. yr | 10. yr | 15. yr | 20. yr | 25. yr | 30. yr | ||
| Million 2005-kr. | |||||||||||
| Priv. consumption | fCp | 321 | 264 | 908 | 1900 | 2591 | 1785 | 222 | 27 | 680 | 1632 |
| Pub. consumption | fCo | -42 | -88 | -172 | -245 | -302 | -481 | -592 | -687 | -774 | -856 |
| Investment | fI | -3772 | -4627 | -1533 | 773 | 1866 | 2237 | 906 | 466 | 709 | 1062 |
| Export | fE | 2920 | 4537 | 6272 | 7914 | 9560 | 16393 | 20736 | 23370 | 24984 | 26027 |
| Import | fM | -1339 | -1478 | 665 | 2415 | 3418 | 4745 | 5108 | 5873 | 6756 | 7492 |
| GDP | fY | 783 | 1456 | 4488 | 7469 | 9750 | 14479 | 15418 | 16515 | 17997 | 19470 |
| 1000 Persons | |||||||||||
| Employment | Q | -16.58 | -18.75 | -16.94 | -13.65 | -10.22 | -0.22 | 1.49 | 1.74 | 1.87 | 1.67 |
| Unemployment | Ul | 8.81 | 9.31 | 8.24 | 6.57 | 4.88 | 0.07 | -0.74 | -0.85 | -0.92 | -0.82 |
| Percent of GDP | |||||||||||
| Pub. budget balance | Tfn_o/Y | -0.09 | -0.18 | -0.06 | 0.07 | 0.18 | 0.45 | 0.48 | 0.52 | 0.57 | 0.63 |
| Priv. saving surplus | Tfn_hc/Y | 0.21 | 0.35 | 0.16 | -0.03 | -0.14 | -0.20 | -0.04 | 0.03 | 0.03 | 0.01 |
| Balance of payments | Enl/Y | 0.12 | 0.17 | 0.09 | 0.04 | 0.04 | 0.24 | 0.44 | 0.55 | 0.60 | 0.64 |
| Foreign receivables | Wnnb_e/Y | 0.54 | 0.91 | 1.05 | 1.09 | 1.12 | 1.75 | 3.24 | 5.09 | 6.95 | 8.70 |
| Bond debt | Wbd_os_z/Y | 0.36 | 0.59 | 0.65 | 0.57 | 0.40 | -1.24 | -3.04 | -4.69 | -6.28 | -7.86 |
| Percent | |||||||||||
| Capital intensity | fKn/fX | -0.17 | -0.34 | -0.57 | -0.74 | -0.85 | -0.97 | -0.93 | -0.94 | -0.96 | -0.94 |
| Labour intensity | hq/fX | -0.71 | -0.87 | -1.00 | -1.08 | -1.11 | -1.06 | -1.03 | -1.02 | -1.02 | -1.02 |
| User cost | uim | -0.48 | -0.63 | -0.76 | -0.86 | -0.94 | -1.12 | -1.14 | -1.12 | -1.07 | -1.02 |
| Wage | lna | -0.40 | -0.75 | -1.07 | -1.34 | -1.54 | -1.91 | -1.86 | -1.73 | -1.59 | -1.43 |
| Consumption price | pcp | -0.47 | -0.65 | -0.80 | -0.93 | -1.05 | -1.37 | -1.47 | -1.49 | -1.46 | -1.41 |
| Terms of trade | bpe | -0.34 | -0.45 | -0.53 | -0.61 | -0.67 | -0.81 | -0.83 | -0.81 | -0.77 | -0.73 |
| Percentage-point | |||||||||||
| Consumption ratio | bcp | 0.02 | -0.06 | -0.04 | 0.04 | 0.11 | 0.12 | -0.02 | -0.09 | -0.09 | -0.08 |
| Wage share | byw | -0.16 | -0.30 | -0.43 | -0.50 | -0.52 | -0.42 | -0.32 | -0.26 | -0.21 | -0.18 |
In this case all five factor inputs are made more efficient. Higher efficiency of factors means that factor inputs can be reduced, consequently investment and employment fall in the short term. The fall, particularly in machinery investment, reduces imports and depreciation, which increases gross operating surplus. As factors efficiency increases prices fall and net exports increase without relying on change in wages. Higher net exports increase production and employment. This offsets the initial fall in employment created by the increase in labor efficiency.
The initial fall in employment pushes wages and prices downward. This improves competitiveness and induce exports to rise even more. As in the previous experiment, the combined effect of higher efficiency and lower wages means that the short-term decrease in factor utilization disappears relatively quickly and the initial negative impact on employment is crowded out in year 5. In the long term, capital intensity and labor intensity fall by approximately 1 percent, excluding the housing sector. The 1 percent higher efficiency of material inputs implies a drop in the import content of demand, and the higher content of domestic value added increases the real wage in equilibrium. Consequently, the real wage rate increases by 2 percent in the long run in this experiment, while the real wage rate drops marginally in experiment 12 where only labor efficiency is increased.
Private consumption increases in the long run, due to the permanent increase in real wages and real disposable income, which is stimulated as the higher productivity increases the real income of transfer recipients. The public budget improves in the long term. The experiment can be seen as a permanent supply shock that lifts the output produced by the employed labor, which is unaffected in the long term.
Figure 14. The effect of a permanent 1 percent increase in labor and capital efficiency
