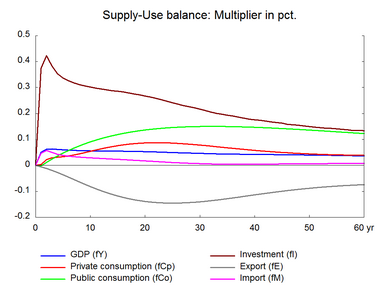
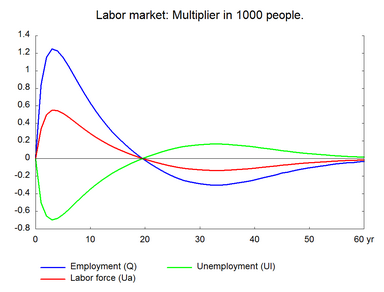
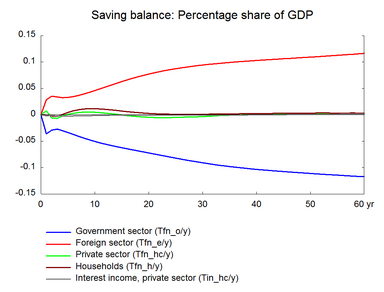
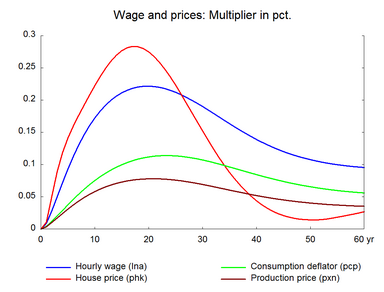
Government investments in buildings and capital in general are often used to boost demand in a weak economy due to a high labor content. Table 3 presents the effect of a permanent increase in general government investment in buildings. Government investment in buildings is increased permanently by 1000 million kroner in 2005 prices, which corresponds to about 5 per cent of the baseline in the first year. (See experiment)
Table 3. The effect of a permanent increase in public investment in buildings
| 1. yr | 2. yr | 3. yr | 4. yr | 5. yr | 10. yr | 15. yr | 20. yr | 25. yr | 30. yr | ||
| Million 2005-kr. | |||||||||||
| Priv. consumption | fCp | 28 | 185 | 249 | 272 | 293 | 511 | 772 | 947 | 1013 | 994 |
| Pub. consumption | fCo | -7 | 48 | 103 | 156 | 207 | 428 | 606 | 749 | 863 | 954 |
| Investment | fI | 1278 | 1419 | 1342 | 1264 | 1230 | 1200 | 1228 | 1239 | 1205 | 1165 |
| Export | fE | -51 | -106 | -177 | -255 | -342 | -834 | -1298 | -1647 | -1857 | -1933 |
| Import | fM | 407 | 508 | 453 | 395 | 363 | 297 | 258 | 205 | 142 | 95 |
| GDP | fY | 807 | 1002 | 1035 | 1020 | 1009 | 1013 | 1070 | 1113 | 1122 | 1132 |
| 1000 Persons | |||||||||||
| Employment | Q | 0.84 | 1.15 | 1.25 | 1.23 | 1.15 | 0.63 | 0.24 | -0.02 | -0.20 | -0.29 |
| Unemployment | Ul | -0.50 | -0.65 | -0.70 | -0.68 | -0.64 | -0.35 | -0.13 | 0.01 | 0.11 | 0.16 |
| Percent of GDP | |||||||||||
| Pub. budget balance | Tfn_o/Y | -0.04 | -0.03 | -0.03 | -0.03 | -0.03 | -0.05 | -0.06 | -0.07 | -0.08 | -0.09 |
| Priv. saving surplus | Tfn_hc/Y | 0.01 | -0.01 | -0.01 | 0.00 | 0.00 | 0.00 | 0.00 | 0.00 | -0.01 | 0.00 |
| Balance of payments | Enl/Y | -0.03 | -0.04 | -0.03 | -0.03 | -0.03 | -0.05 | -0.06 | -0.08 | -0.09 | -0.09 |
| Foreign receivables | Wnnb_e/Y | -0.06 | -0.12 | -0.16 | -0.20 | -0.23 | -0.41 | -0.62 | -0.86 | -1.12 | -1.37 |
| Bond debt | Wbd_os_z/Y | 0.01 | 0.03 | 0.05 | 0.07 | 0.10 | 0.27 | 0.48 | 0.71 | 0.96 | 1.20 |
| Percent | |||||||||||
| Capital intensity | fKn/fX | -0.03 | -0.01 | 0.01 | 0.03 | 0.05 | 0.13 | 0.18 | 0.21 | 0.23 | 0.24 |
| Labour intensity | hq/fX | -0.02 | -0.02 | -0.01 | -0.01 | -0.01 | -0.01 | -0.02 | -0.02 | -0.02 | -0.03 |
| User cost | uim | 0.01 | 0.01 | 0.02 | 0.03 | 0.04 | 0.07 | 0.08 | 0.09 | 0.08 | 0.08 |
| Wage | lna | 0.01 | 0.03 | 0.05 | 0.07 | 0.09 | 0.17 | 0.21 | 0.22 | 0.21 | 0.19 |
| Consumption price | pcp | 0.00 | 0.01 | 0.02 | 0.03 | 0.04 | 0.08 | 0.10 | 0.11 | 0.11 | 0.11 |
| Terms of trade | bpe | 0.00 | 0.01 | 0.01 | 0.02 | 0.03 | 0.05 | 0.06 | 0.06 | 0.06 | 0.06 |
| Percentage-point | |||||||||||
| Consumption ratio | bcp | -0.02 | -0.01 | 0.00 | 0.00 | 0.00 | 0.00 | 0.01 | 0.02 | 0.02 | 0.02 |
| Wage ratio | byw | -0.01 | 0.00 | 0.00 | 0.01 | 0.01 | 0.02 | 0.01 | 0.00 | 0.00 | -0.01 |
The higher public investment raises private sector production and employment in the short run. Compared to the government purchase of goods and services experiment, the effect on the domestic economy is larger because the import content of building investments is low. The income multiplier increases the initial effect proportionally.
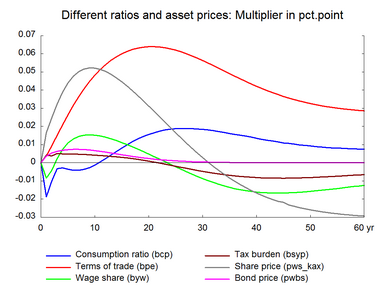
In the medium term, the expansion in the domestic economy entails a higher wage and price level and a fall in competitiveness. A lower competitiveness reduces exports and raises imports. Consequently, domestic production and employment fall. Over time the effect on unemployment disappears.
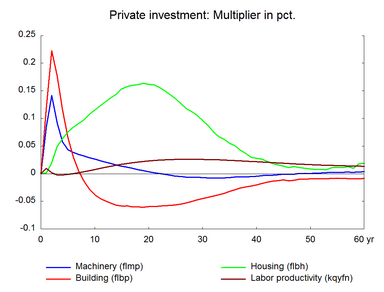
The expansionary nature of public investment raises production in the short run. The higher production requires an equivalent increase in capital. And a given change in capital requires a more than proportional change in investment. This is because capital stock is far larger than annual investment. As a result, the impact on investment peaks strongly in the short run. This reflects the accelerator mechanism. The accelerator impact on buildings is larger than the impact on machinery. This is because buildings are used for longer periods and the ratio between capital stock and investment is higher.
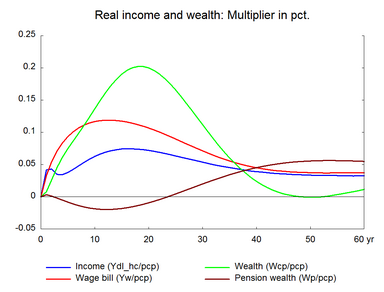
As in the previous two experiments, real wages increase permanently leading to a permanent positive effect on private consumption.
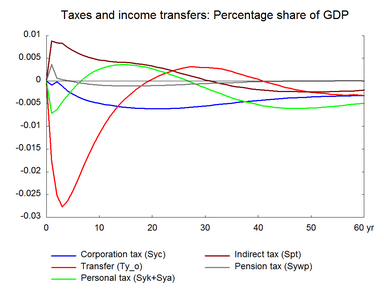
Higher public investment in a period may be financed by lower public investments during economic boom. A permanent increase in public investments can deteriorate the government budget permanently, which may require other fiscal measures such as a tax increase.
Figure 3. The effect of a permanent increase in public investment in buildings
