We can also increase the output capacity of the economy by increasing the efficiency of machines. An increase in machinery efficiency leads to a substitution of machinery for labor and other factors of production. Production will then be less capital intensive with the usual measure of capital. If, however, capital is measured in efficiency units, production will become more capital intensive.Table 13 presents the effect of a permanent 1 per cent increase in machinery efficiency. (See experiment)
Table 13. The effect of a permanent increase in machinery efficiency
| 1. yr | 2. yr | 3. yr | 4. yr | 5. yr | 10. yr | 15. yr | 20. yr | 25. yr | 30. yr | ||
| Million 2005-kr. | |||||||||||
| Priv. consumption | fCp | 4 | -158 | -135 | 246 | 566 | 1160 | 1436 | 1785 | 2136 | 2412 |
| Pub. consumption | fCo | 25 | 14 | -26 | -55 | -74 | -132 | -158 | -173 | -186 | -199 |
| Investment | fI | -2512 | -3757 | -1965 | -1056 | -806 | -619 | -848 | -1060 | -1206 | -1334 |
| Export | fE | 254 | 452 | 641 | 809 | 970 | 1414 | 1274 | 874 | 484 | 230 |
| Import | fM | -1364 | -2024 | -869 | -199 | 39 | 311 | 232 | 125 | 31 | -52 |
| GDP | fY | -829 | -1374 | -598 | 138 | 595 | 1461 | 1424 | 1260 | 1163 | 1130 |
| 1000 Persons | |||||||||||
| Employment | Q | -1.15 | -2.00 | -1.66 | -0.92 | -0.23 | 1.47 | 1.30 | 0.71 | 0.26 | -0.01 |
| Unemployment | Ul | 0.68 | 1.15 | 0.90 | 0.48 | 0.10 | -0.82 | -0.71 | -0.39 | -0.14 | 0.01 |
| Percent of GDP | |||||||||||
| Pub. budget balance | Tfn_o/Y | -0.03 | -0.06 | -0.03 | 0.00 | 0.02 | 0.07 | 0.07 | 0.06 | 0.05 | 0.05 |
| Priv. saving surplus | Tfn_hc/Y | 0.12 | 0.19 | 0.11 | 0.04 | 0.01 | -0.03 | -0.02 | 0.00 | 0.00 | 0.00 |
| Balance of payments | Enl/Y | 0.09 | 0.14 | 0.07 | 0.04 | 0.03 | 0.04 | 0.05 | 0.05 | 0.05 | 0.05 |
| Foreign receivables | Wnnb_e/Y | 0.13 | 0.31 | 0.35 | 0.36 | 0.37 | 0.43 | 0.56 | 0.70 | 0.82 | 0.90 |
| Bond debt | Wbd_os_z/Y | 0.06 | 0.13 | 0.14 | 0.13 | 0.10 | -0.18 | -0.46 | -0.65 | -0.76 | -0.82 |
| Percent | |||||||||||
| Capital intensity | fKn/fX | 0.00 | -0.04 | -0.10 | -0.15 | -0.17 | -0.19 | -0.14 | -0.11 | -0.09 | -0.07 |
| Labour intensity | hq/fX | 0.00 | 0.00 | -0.04 | -0.05 | -0.06 | -0.04 | -0.04 | -0.04 | -0.04 | -0.04 |
| User cost | uim | -0.02 | -0.04 | -0.07 | -0.09 | -0.09 | -0.07 | -0.04 | -0.01 | 0.01 | 0.02 |
| Wage | lna | -0.02 | -0.06 | -0.09 | -0.12 | -0.13 | -0.06 | 0.06 | 0.15 | 0.19 | 0.20 |
| Consumption price | pcp | -0.02 | -0.04 | -0.06 | -0.08 | -0.09 | -0.09 | -0.06 | -0.02 | 0.01 | 0.02 |
| Terms of trade | bpe | -0.02 | -0.03 | -0.05 | -0.06 | -0.06 | -0.06 | -0.03 | -0.01 | 0.00 | 0.01 |
| Percentage-point | |||||||||||
| Consumption ratio | bcp | 0.02 | 0.02 | 0.00 | 0.02 | 0.05 | 0.08 | 0.08 | 0.08 | 0.08 | 0.08 |
| Wage ratio | byw | 0.01 | 0.01 | -0.01 | -0.02 | -0.02 | 0.03 | 0.06 | 0.07 | 0.07 | 0.07 |
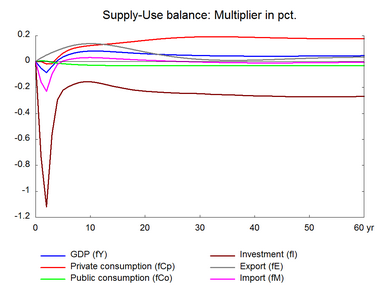
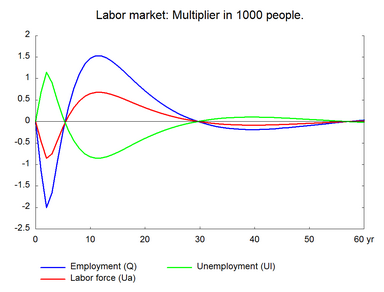
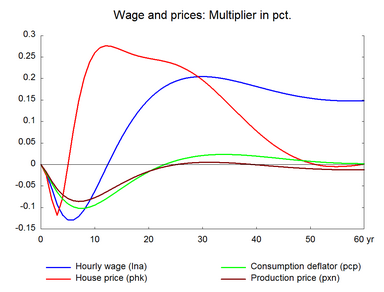
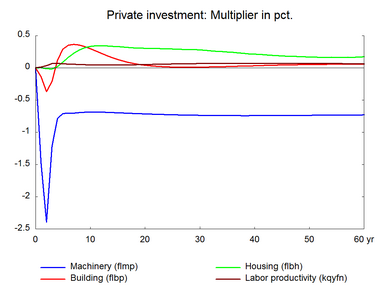
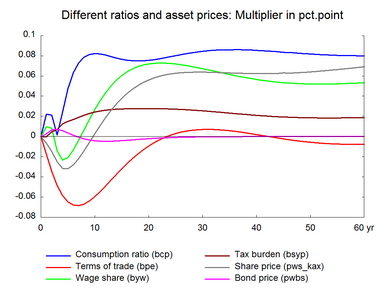
As the efficiency of machines improve, the stock of machinery can be reduced, so investment in machinery falls. It also leads to a substitution of capital for labor as machine capital becomes cheaper. Consequently, employment and production fall in the short run reducing machinery investment further. Due to the high import content of machinery investments, imports also fall in the short run. The fall in machinery reduces capital cost per unit of output, and the higher unemployment reduces wages. The combined effect is a fall in prices. As prices fall competitiveness improves and hence exports and production rise. Over time employment returns to the baseline.
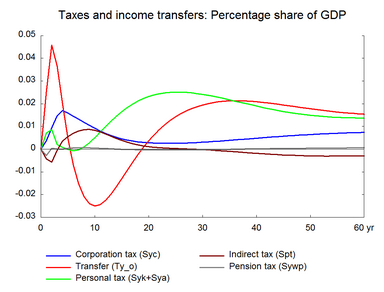
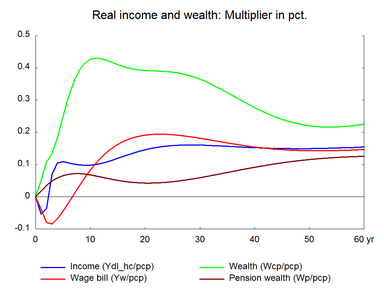
Private consumption falls initially, and in the long run it rises permanently. This is because real income falls first before it permanently increases in the long run. It is noted that the higher machinery efficiency will also stimulate the real income of transfer recipients. There is a permanent fall in machinery investment since the lower machinery inventory requires lower reinvestment. The lower private machinery investment increases the score for higher private consumption. In the long run there is a slight positive effect on the nominal wage and a negligible impact on exports.
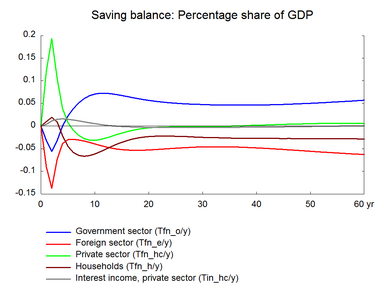
Public finances deteriorate first as transfer payments to the unemployed increase in the short run. In the long run public finances are in surplus.
Figure 13. The effect of a permanent 1 per cent increase in machinery efficiency
